- Analytics
- News and Tools
- Quotes
- Chart and quotes for AUDJPY
CFD Trading Rate Australian Dollar vs Japanese Yen (AUDJPY)
| Date | Rate | Change |
|---|
Related news
-
21.03.2024 09:13AUD/JPY firms up on reduced expectations of RBA rate cuts, inches higher to near 99.90
- AUD/JPY extends its winning streak on positive employment figures from Australia.
- Australian Employment Change increased to 116.5K compared to the expected 40.0K in February.
- JPY weakens on the BoJ’s indication of accommodative financial conditions.
AUD/JPY continues to extend its gains that began on March 15, trading higher around 99.90 during the European session on Thursday. The Australian Dollar (AUD) maintained its upward trajectory supported by positive economic data from Australia, bolstering the AUD/JPY cross.
However, the Australian equity market moved back and forth but closed in positive territory, further reinforcing the AUD's gains. The ASX 200 Index experienced a surge, following a rally on Wall Street from the previous session.
In February, the seasonally adjusted Employment Change saw a significant surge to 116.5K, surpassing expectations of 40.0K and the previous figure of 15.3K. Moreover, the Unemployment Rate increased by 3.7%, below the anticipated 4.0% and the previous 4.1%.
Australia's private sector demonstrated resilience in March, extending its expansion for the second consecutive month. The preliminary Judo Bank Services PMI rose to 53.5 from the previous 53.1, indicating continued growth in the services sector. Additionally, the Composite PMI increased to 52.4 from 52.1, reflecting a broad-based expansion in services.
However, there was a decline in the Manufacturing PMI, dropping to 46.8 from the previous 47.8. This contraction suggests a slowdown in manufacturing activity during the same period, potentially influenced by various factors such as supply chain disruptions or weakening demand.
The Japanese Yen (JPY) faces losses amidst the prevailing risk-on sentiment. The Bank of Japan (BoJ) recently indicated that financial conditions would remain accommodative, refraining from guiding future policy steps or the pace of policy normalization.
Chief Cabinet Secretary Yoshimasa Hayashi of Japan stated on Thursday that he is closely monitoring foreign exchange (FX) movements with urgency. He emphasized the need to closely observe the impact on both the Japanese and global economies following the Federal Reserve's decision.
-
20.03.2024 21:12AUD/JPY Price Analysis: Bulls maintain positive momentum, overbought conditions hint at possible pullback
- The daily chart analysis reveals consistent bullish sentiment with RSI nearing overbought conditions, indicating possible pullbacks.
- The AUD/JPY hourly chart paints a similar picture, with the RSI deep in overbought terrain.
- Even with a potential short-term bearish correction, the AUD/JPY standing above SMA shows an overall bullish trend.
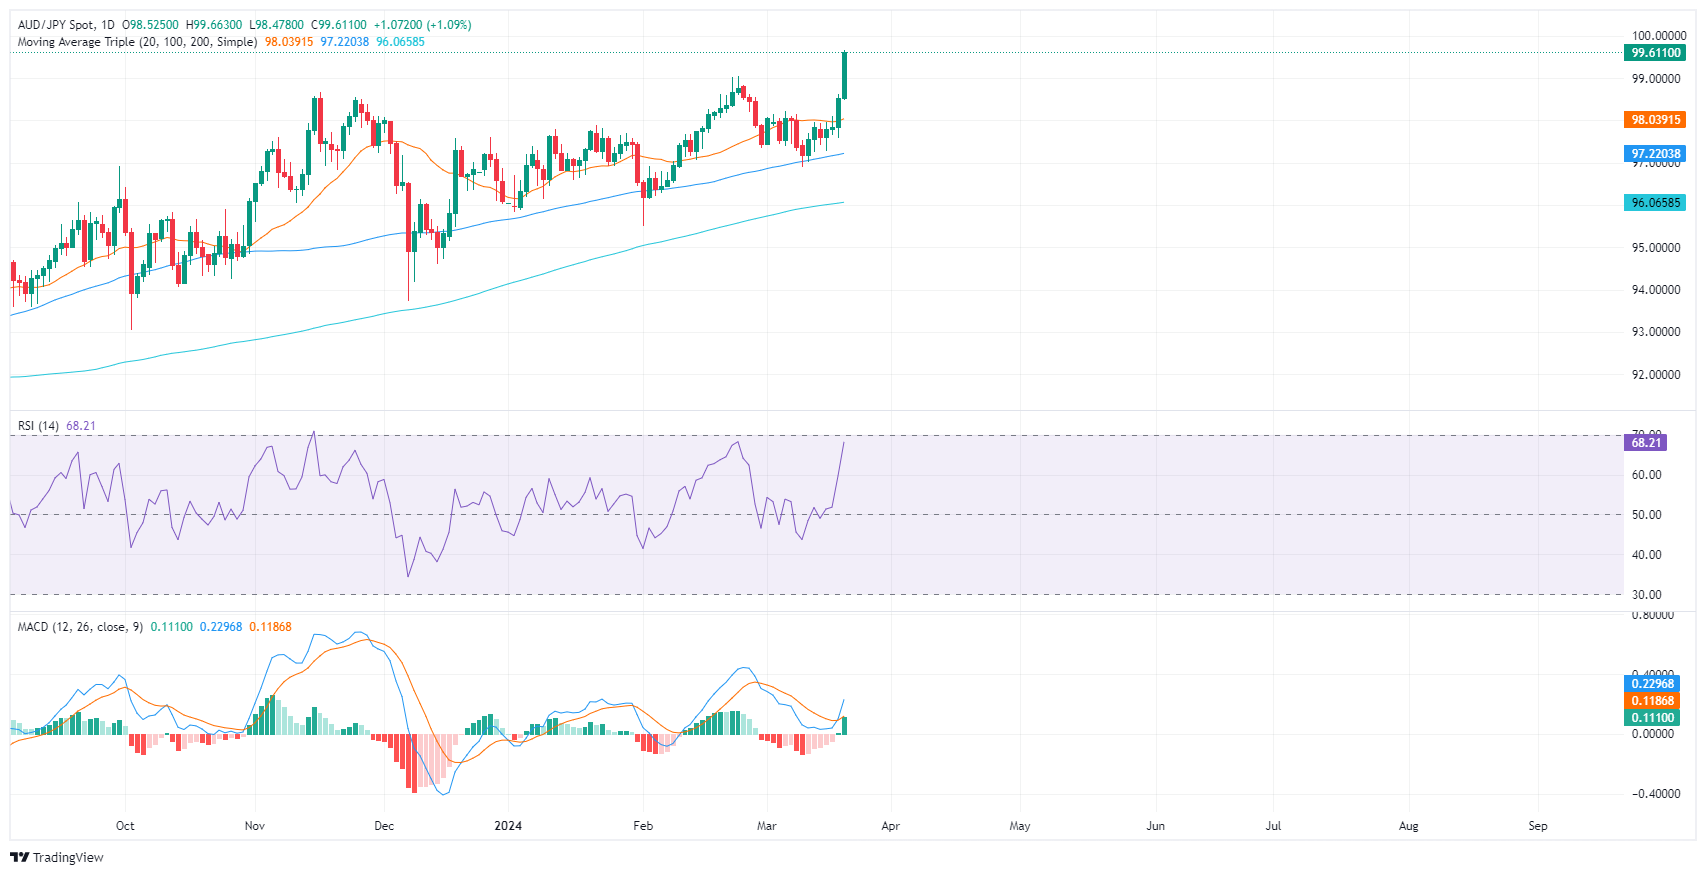
In Wednesday's session, AUD/JPY is experiencing an uptake, trading at 99.62, its highest level since 2014, and showing a gain of 1.15%. Although there are hints of a short-term consolidation incoming, any downward movements could be considered as a mere technical correction.
Based on the indicators of the daily chart for the AUD/JPY pair, a positive trend is seen, as indicated by the positive territory of the Relative Strength Index (RSI). The RSI is nearing the overbought territory, signaling that while the trend is bullish, an increasing risk of a pullback due to overbought conditions is also present. In agreement with this, the Moving Average Convergence Divergence (MACD) histogram also reveals a rising trend, indicated by green bars, corroborating the positive momentum.
AUD/JPY daily chart
Contrarily, on the hourly chart, the AUD/JPY pair shows a sharp move into the overbought territory, as indicated by the RSI of 78. This demonstrates that the pair might face a corrective pullback in the short term given these extreme over-extended conditions. The MACD histogram also confirms this, as it continues to print green bars.
AUD/JPY hourly chart
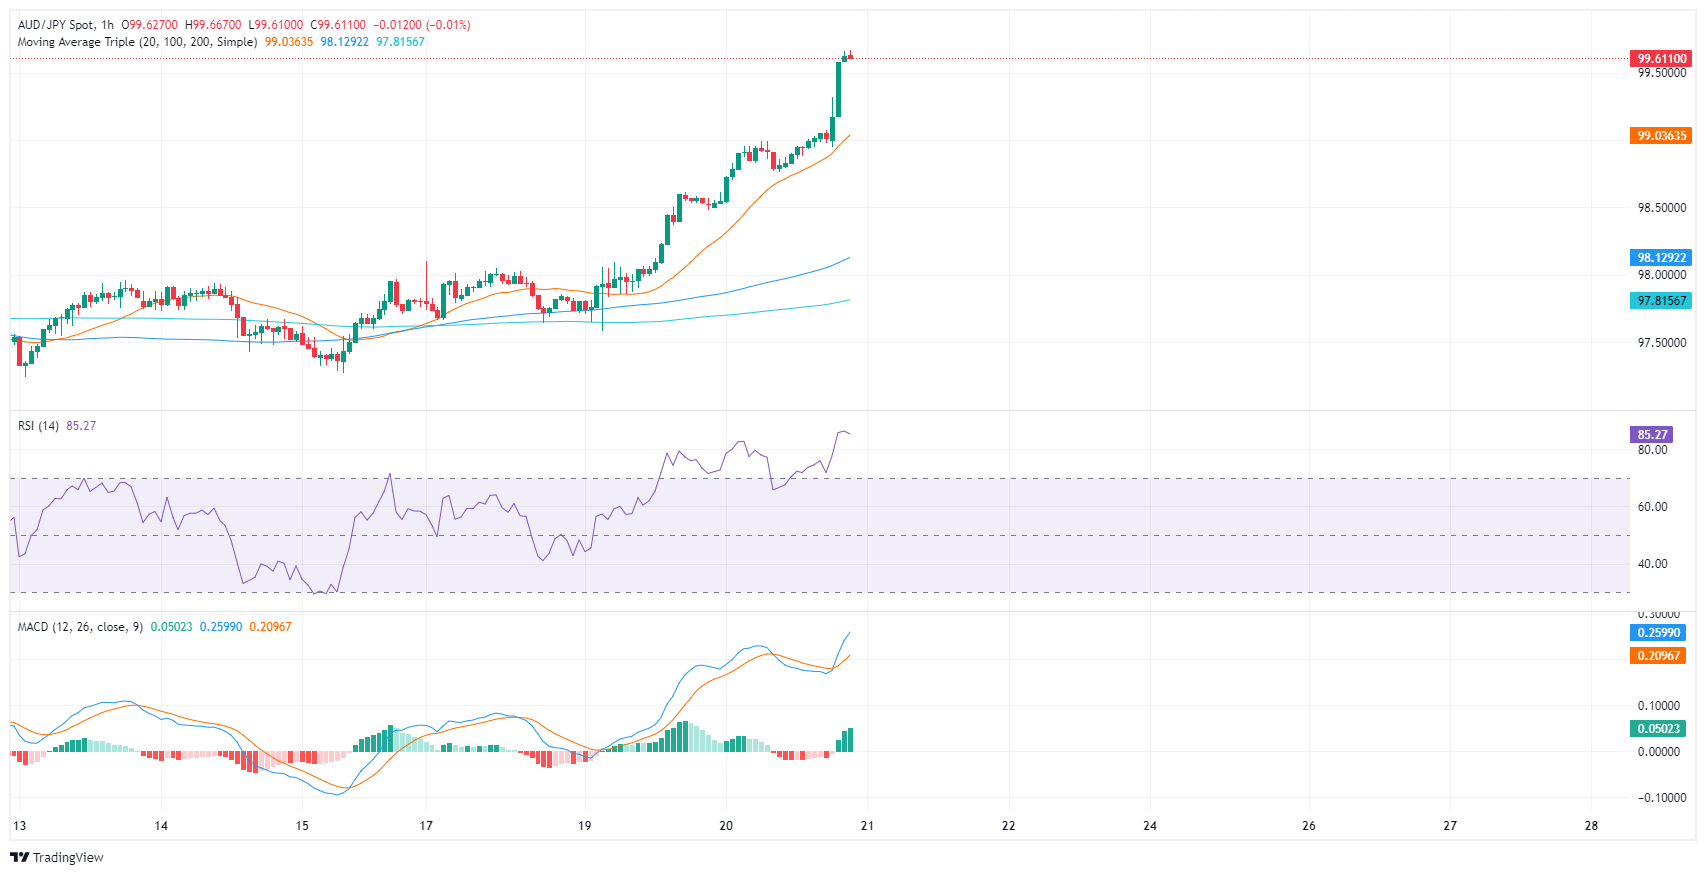
These observations generally point towards bullish conditions for the AUD/JPY pair in the short term but buyers might consider taking profits in the next sessions. On a broader perspective, buyers are also in command as the pair trades above the 20,100 and 200-day Simple Moving Averages (SMAs).
-
20.03.2024 06:21AUD/JPY Price Analysis: Gains momentum below the 99.00 mark amid the overbought condition
- AUD/JPY attracts some buyers around 98.95 in Wednesday’s early European session.
- The cross resumes its bullish outlook with the overbought RSI condition.
- The first upside barrier is located in the 99.00–99.05 region; 98.10 acts as an initial support level.
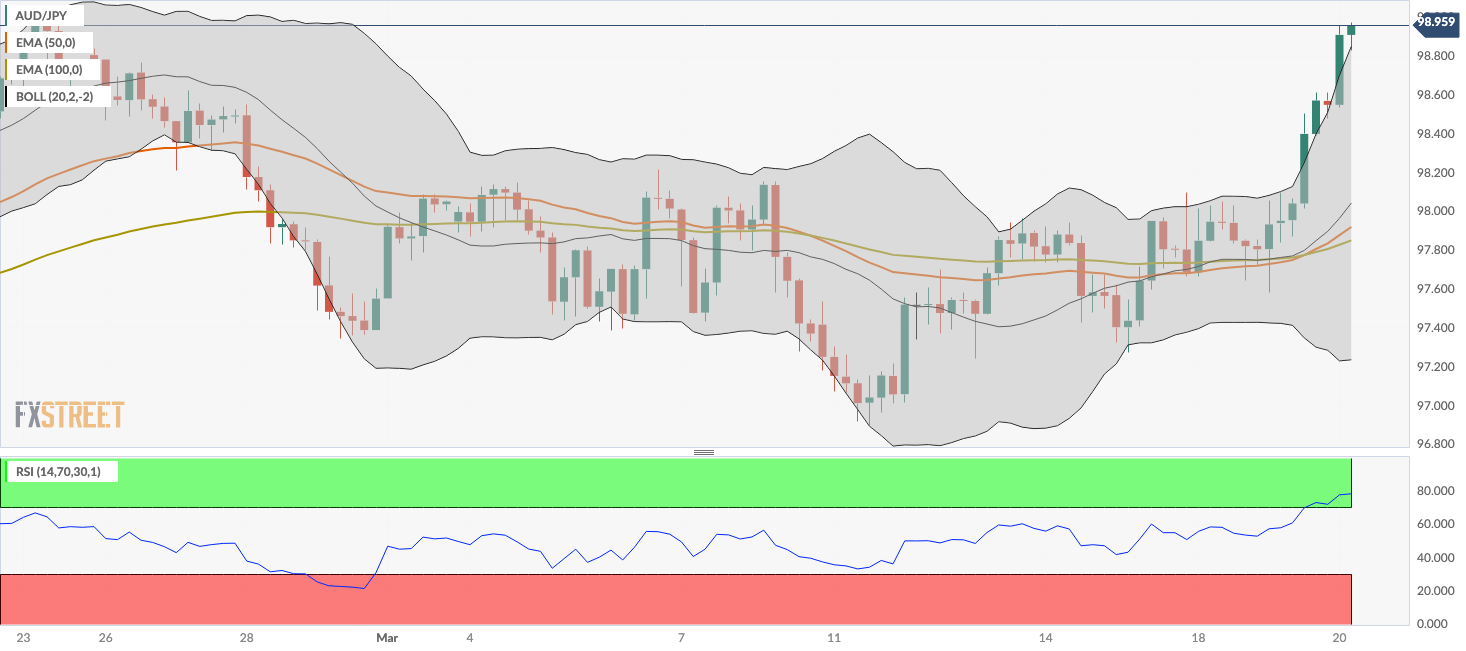
The AUD/JPY cross gains traction below the 99.00 psychological barrier during the early European trading hours on Wednesday. The decline of the Japanese Yen (JPY) to a multi-month low following the Bank of Japan’s (BoJ) dovish hike on Tuesday creates a tailwind for the cross. At the press time, the cross is trading at 98.95, up 0.43% on the day.
Technically, AUD/JPY keeps the bullish vibe unchanged as the cross is above the key 100-period Exponential Moving Averages (EMAs) on the four-hour chart. The Relative Strength Index (RSI) holds in bullish territory above the 50 midline. However, the overbought RSI condition indicates that further consolidation cannot be ruled out before positioning for any near-term AUD/JPY appreciation.
The first upside barrier for the cross will emerge at the 99.00–99.05 zone, representing a high of February 23 and a round figure. The key hurdle is seen at the psychological round mark of 100.00. Further north, the next upstate target is located near a weekly low of May 10, 2013 at 100.40.
On the other hand, a high of March 17 at 98.10 acts as an initial support level for AUD/JPY. The next contention level to watch is the 100-period EMA at 97.85. Any follow-through selling below the latter will resume the downside and drag the cross lower to a low of March 18 at 97.65, followed by the lower limit of the Bollinger Band at 97.24.AUD/JPY four-hour chart
-
19.03.2024 03:46AUD/JPY struggles to lure buyers, remains below 98.00 mark after RBA/BoJ announcements
- AUD/JPY retreats from over a one-week high after the RBA and the BoJ announced their decisions.
- The RBA decided to keep the benchmark rates unchanged for the third straight meeting in March.
- The BoJ ends the negative interest rates era and also scraps the Yield Curve Control (YCC) policy.
The AUD/JPY cross continues with its struggle to find acceptance above the 98.00 mark and surrenders Asian session gains to over a one-week high. Spot prices drop to a fresh daily low after the Reserve Bank of Australia (RBA) and the Bank of Japan (BoJ) announced their policy decisions, albeit manage to attract fresh buyers in the vicinity of mid-97.00s.
As was unanimously expected, the Australian central bank decided to keep the Official Cash Rate (OCR) unchanged at the end of the March policy meeting. The Australian Dollar (AUD), however, started losing traction in the absence of any fresh hawkish signals, though signs of improving relations between Australia and China – the former's biggest trading partner – help limit further losses.
Meanwhile, the BoJ announced lifting the interest rate by 10 basis points (bps) from -0.1% to 0% for the first time since 2007, ending the negative interest rate era that began in 2016. The BoJ also scrapped its Yield Curve Control (YCC) policy at the conclusion of its two-day monetary policy meeting. The decision, however, was broadly in line with the market expectations and did little to influence the JPY.
Investors now look forward to the post-meeting press conference, where comments by BoJ Governor Kazuo Ueda will play a key role in influencing the JPY price dynamics and provide some meaningful impetus to the AUD/JPY cross. The mixed fundamental backdrop, meanwhile, makes it prudent to wait for strong follow-through buying before positioning for any further appreciating move.
-
18.03.2024 19:47AUD/JPY Price Analysis: Bulls remain weak and give up daily gains
- The AUD/JPY gave up daily gains and struggled to make a decisive upward movement.
- The hourly chart signals a shift to short-term bearish traction, with a downturn of the RSI.
- To ensure continued bullish momentum, buyers must defend the main SMAs.
On Monday's session, the AUD/JPY pair is trading at 97.71, mildly down after peaking at a high of around 98.10, near the 20-day Simple Moving Average (SMA). Unless the buyers conquer this level, any upward attempt will be limited and the short-term outlook will be tilted in favor of the buyers.
Based on the indicators of the daily chart, the Relative Strength Index (RSI) has remained within the positive territory over the last several sessions, thus revealing a steady positive momentum. The Moving Average Convergence Divergence (MACD), however, reveals a less optimistic picture by displaying decreasing red bars, indicating a steady negative momentum and giving arguments for a neutral to bearish outlook.
AUD/JPY daily chart
On the hourly chart, the RSI started the day around the 61 level representing a strong momentum, gradually losing strength as the session progressed to fall into the negative territory around 42 by the American session. The Moving Average Convergence Divergence (MACD) histogram, on the other hand, is increasing but remains in the negative territory, as represented by the rising red bars. Sellers seem to currently hold the reins in the hourly perspective.
AUD/JPY hourly chart
All in all, ahead of the Asian session, the sellers may continue gaining ground, and unless the buyers get a fundamental boost, they will have a hard time conquering the 20-day SMA to confirm a recovery. However, the primary task is to defend the 100 and 200-day SMAs to defen the long-term bullish outlook.
-
18.03.2024 14:23AUD/JPY Price Analysis: Refreshes weekly high near 98.00 ahead of BoJ-RBA policy decisions
- AUD/JPY jumps to 98.00 as the BoJ is expected to delay plans of exiting an ultra-dovish stance.
- BoJ Ueda manifested a bleak assessment of Japan’s economic outlook.
- The RBA is expected to keep its OCR steady at 4.35%.
The AUD/JPY pair prints a fresh weekly high near 98.00 in Monday’s early American session as the market sentiment remains upbeat. The market mood remains cheerful as China’s better-than-projected Retail Sales and Industrial Production data for February indicated a robust recovery in domestic demand.
The Australian Dollar capitalizes on China’s upbeat data, which is considered a proxy for Chinese economic growth. Going forward, the next move in the Australian Dollar will be guided by the Reserve Bank of Australia’s (RBA) interest rate decision, which will be announced on Tuesday. The RBA is widely anticipated to keep the Official Cash Rate (OCR) steady at 4.35%.
Meanwhile, the Japanese Yen remains under pressure as Bank of Japan (BoJ) Governor Kazuo Ueda’s bleak assessment of the economy has undermined sticky inflation above 2% and higher wage hikes rewarded by big firms. Market expectations for the BoJ announcing an end to negative interest rates and the Yield Curve Control (YCC) policy have shifted for the April meeting as uncertainty persists over the wage price spiral.
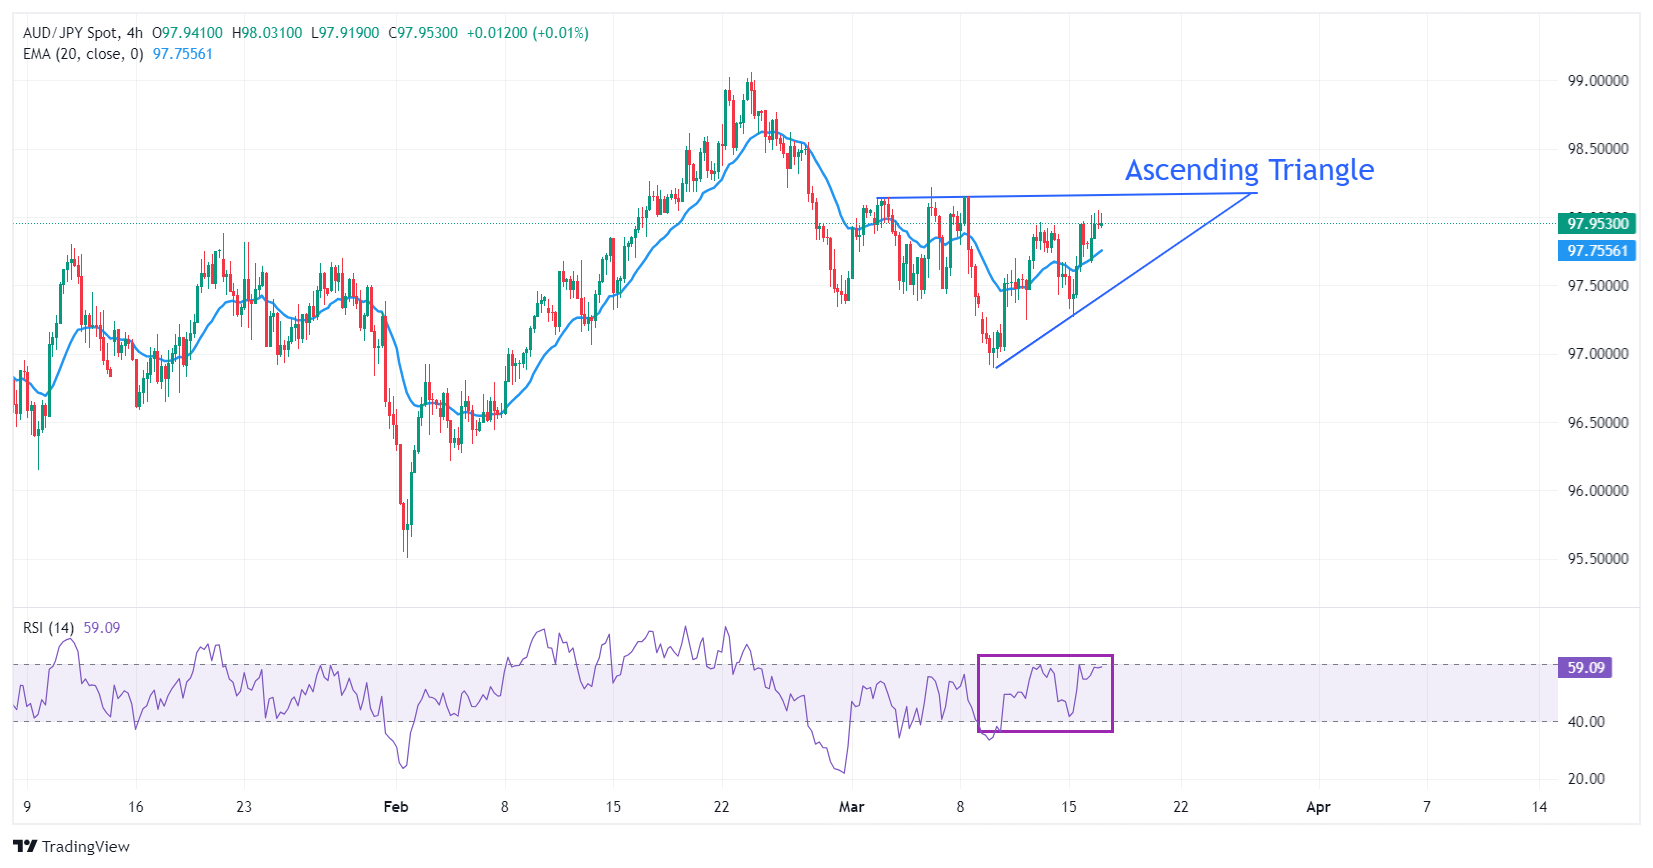
AUD/JPY approaches the horizontal resistance of the Ascending Triangle pattern formed on a four-hour timeframe, plotted from the March 4 high at 98.13. The upward-sloping border of the aforementioned pattern is placed from March 11 low at 96.90.
The 20-day Exponential Moving Average (EMA) near 97.75 remains sticky to the risk-barometer, indicating a sideways trend.
The 14-period Relative Strength Index (RSI) oscillates inside the 40.00-60.00 region, which indicates indecisiveness among investors.
The appeal for the AUD/JPY would strengthen if the asset breaks above March 6 high at 98.27, which will drive the asset towards February 20 high at 98.61 and February 23 high at 99.06.
On the flip side, the asset's appeal could weaken if it drops below its March 15 low at 97.27. This would expose the asset to its March 11 low at 96.90. A breakdown below that would extend the downside towards its January 16 low at 96.59.
AUD/JPY four-hour chart
-
18.03.2024 04:32AUD/JPY bulls struggle to capitalize on move beyond 98.00, await BoJ and RBA on Tuesday
- AUD/JPY climbs to over one-week top on Monday, though the upside remains capped.
- The BoJ policy uncertainty keeps the JPY bulls on the defensive and lends some support.
- Traders seem reluctant to place aggressive bets ahead of the BoJ and RBA on Tuesday.
The AUD/JPY cross attracts some buyers for the second successive day on Monday, albeit struggles to capitalize on the modest intraday uptick beyond the 98.00 round-figure mark. Traders opt to wait on the sidelines ahead of the key central bank event risks on Tuesday, warranting some caution before positioning for an extension of last week's bounce from sub-97.00 levels, or over a one-month low.
The Bank of Japan (BoJ) and the Reserve Bank of Australia (RBA) are scheduled to announce their policy decisions on Tuesday, which will play a key role in providing a fresh directional impetus to the AUD/JPY cross. In the meantime, BoJ Governor Kazuo Ueda's slightly bleaker assessment of the economy last week is seen undermining the Japanese Yen (JPY) and acting as a tailwind for spot prices.
In fact, Ueda, speaking in parliament last Tuesday, noted that the economy is showing some signs of weakness, pointing to the recent batch of soft data on consumption. This might have smashed hopes for an imminent shift in the BoJ's policy stance in March, which, along with stability in the equity markets, seem to weigh on the safe-haven JPY and lend some support to the AUD/JPY cross.
The Australian Dollar (AUD), on the other hand, remains supported by signs of improving relations between Australia and China – the former's biggest trading partner. Adding to this, the upbeat Chinese macro data, showing that Retail Sales and Industrial Production rose more than expected in February, turns out to be another factor that benefits antipodean currencies, including the Aussie.
Meanwhile, the positive outcome from the spring wage negotiations seems to have paved the way for the BoJ to exit its negative interest rate policy sooner rather than later. This holds back the JPY bears from placing aggressive bets and keeps a lid on any further gains for the AUD/JPY cross. Hence, it will be prudent to wait for strong follow-through buying before confirming that spot prices have bottomed out.
-
15.03.2024 09:12AUD/JPY hovers around 97.50 after paring losses, RBA, BoJ decisions loom
- AUD/JPY faces headwinds on market anticipation of a shift in the BoJ's policy stance.
- Reuters cited news agency Jiji that the BoJ plans to end its negative interest rate policy.
- RBA maintains its potential stance for further rate hikes ahead of the policy decision on Tuesday.
AUD/JPY trims some of its daily losses and trades lower around 97.50 during the European hours on Friday. The AUD/JPY cross faces headwinds as the Japanese Yen strengthens, driven by market anticipation of a potential shift in the Bank of Japan's policy stance, following reports of major Japanese companies fully responding to union demands for wage hikes.
Additionally, Reuters reported on Thursday, citing Japanese news agency Jiji, that the Bank of Japan is planning to discontinue its negative interest rate policy during the March 18-19 meeting. The final decision will depend on the outcome of the preliminary survey regarding this year's spring wage negotiations by the labor organization Rengo, expected on Friday.
Meanwhile, the AUD/JPY cross gains some upward momentum as the Australian Dollar weakens amid a broad market sell-off, particularly evident in the lower S&P/ASX 200 Index. Australian equities mirror losses seen on Wall Street, with significant declines observed in banking and iron ore mining sectors.
Despite these challenges, the AUD/JPY cross may find support as the Reserve Bank of Australia (RBA) maintains its potential stance for further rate hikes. Analysts, according to a Reuters poll conducted before the RBA meeting, anticipate the central bank to keep its official cash rate unchanged at 4.35% for a third consecutive meeting, with no expected adjustments until at least the end of September.
Looking ahead, both the RBA and the Bank of Japan are scheduled to announce their policy decisions on Tuesday, adding further anticipation to the market regarding monetary policy directions.
-
15.03.2024 04:42AUD/JPY attracts some sellers below 97.40, RBA, BoJ rate decision are in the spotlight
- AUD/JPY edges lower to 97.35 in Friday’s Asian session.
- Australian central bank is expected to maintain its key interest rate and policy stance in its March meeting.
- The financial market opinion is split on whether the BoJ will raise the rates in March or April.
The AUD/JPY cross trades on a weaker note below the mid-97.00s during the Asian trading hours on Friday. Investors will closely monitor the Reserve Bank of Australia (RBA) and the Bank of Japan (BoJ) interest rate decisions next week. These events might cause volatility in the market. At the press time, AUD/JPY is trading at 97.35, losing 0.27% on the day.
The RBA is anticipated to hold its key interest rate at 4.35% for a third consecutive meeting next week. Investors have priced in the first rate cuts in its June meeting. The RBA is likely to maintain its hawkish stance as inflation remains elevated. However, any hawkish warning from the Australian central bank might weigh on the Australian Dollar (AUD) against the Japanese Yen (JPY).
On the other hand, the financial market is split on whether the BoJ will raise rates in March or April. Investors believe that an April hike is slightly more likely than a March hike, but the possibility of a March hike cannot be ruled out since the large companies in Japan have offered their employees the highest wage increase in over three decades. The lower bets that the BoJ will end negative rates soon might drag the JPY lower and act as a tailwind for the AUD/JPY cross. -
14.03.2024 09:03AUD/JPY climbs closer to 97.90, buoyed by prospect of RBA considering rate hikes
- AUD/JPY continues to move in a positive direction as RBA hinted at increasing policy rates.
- RBA Governor Michelle Bullock anticipates that inflation will not return to its target until 2026.
- Japanese Yen faces challenges on reduced expectations for an early interest rate hike by BoJ.
AUD/JPY extends its upward trajectory for the third consecutive session, reaching around 97.90 during European trading hours on Thursday. The AUD/JPY cross receives upward momentum as the Reserve Bank of Australia (RBA) continues to hint at the possibility of further rate hikes.
RBA Governor Michelle Bullock recently emphasized that inflation in Australia is primarily "homegrown" and "demand-driven," fueled by the robust labor market and increasing wage inflation. The RBA does not foresee inflation returning to its target until 2026.
However, the decline in the S&P/ASX 200 Index, driven by losses in financial-linked shares despite gains in iron ore miners, may have exerted downward pressure on the Australian Dollar. Consequently, this has limited the advance of the AUD/JPY cross.
On the other side, the Japanese Yen (JPY) encounters hurdles amid reduced expectations for an early interest rate hike by the Bank of Japan (BoJ). Additionally, the prevailing risk-on sentiment diminishes demand for the safe-haven JPY, thereby acting as a tailwind for the AUD/JPY pair.
However, Japanese media outlets have indicated that more BoJ policymakers are supporting the notion of a policy shift at the upcoming policy meeting, as significant pay hikes by major companies bring the 2% price stability target within reach. The higher-than-expected producer inflation data from Japan reinforces the belief that the BoJ could initiate rate hikes soon.
On Wednesday, Japan's spring wage negotiations revealed that firms have yielded to the demands of the country's largest trade union confederation, Rengo, agreeing to pay increases of 5.85% this year, surpassing 5.0% for the first time in 30 years. Furthermore, Japan's largest industrial union, UA Zensen, reported on Thursday that the average pay rise offered by 231 service-sector firms has reached the highest level on record since 2013.
-
13.03.2024 22:18AUD/JPY Price Analysis: Bulls found some gains on Wednesday, bears still present
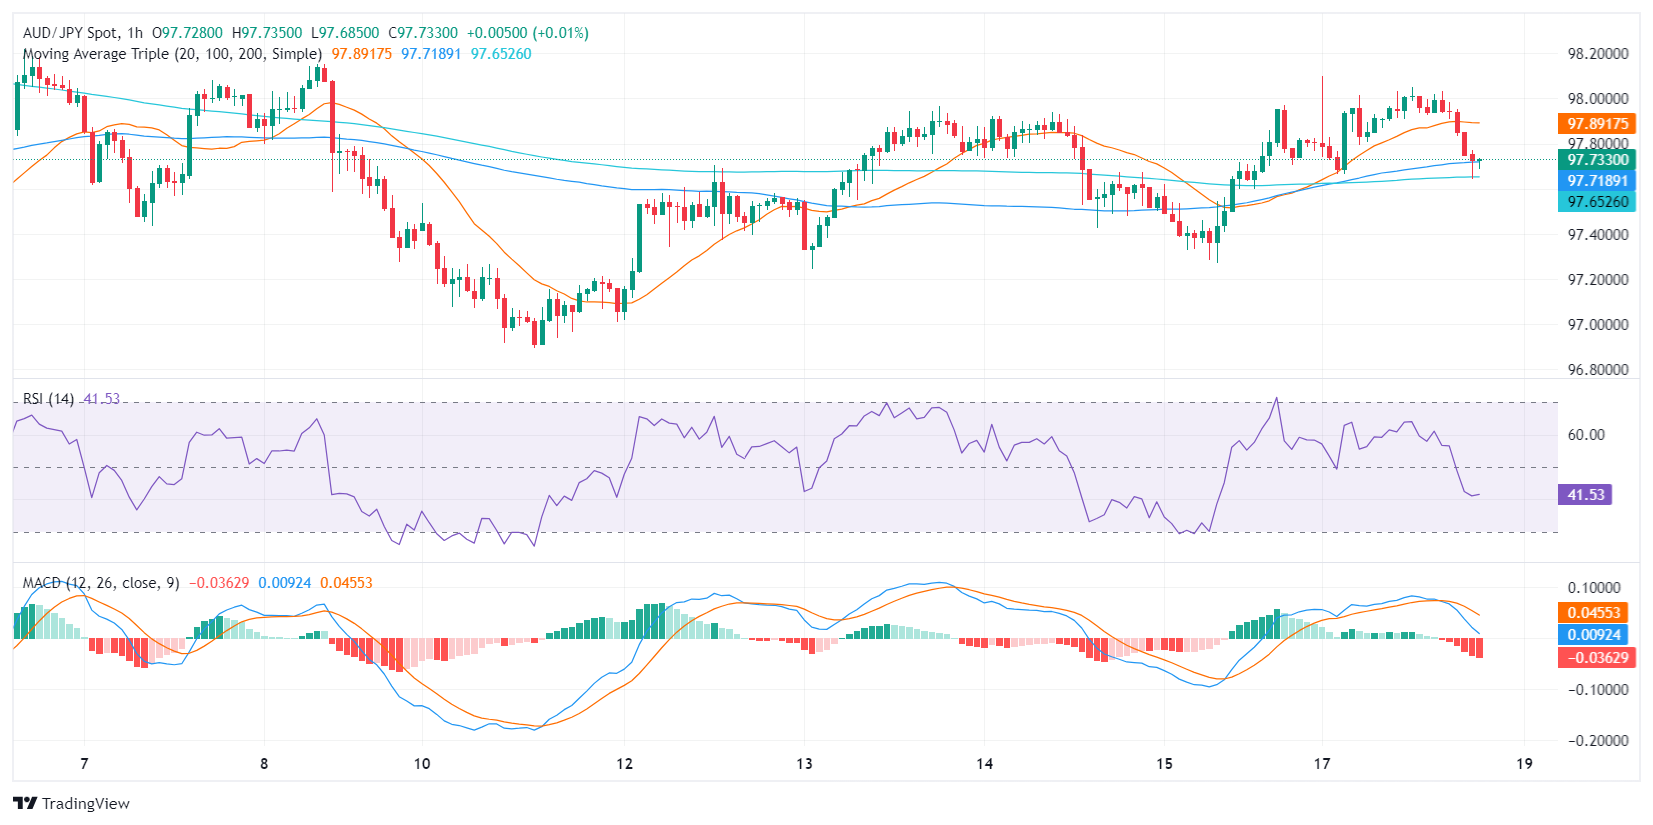
- The daily chart shows that the RSI is now above 50 showing a surge in buying momentum.
- On the hourly chart, the RSI hit a peak of 68 and turned south.
- Despite minor bearish signs, the pair above main SMAs confirms an overall bullish trend.
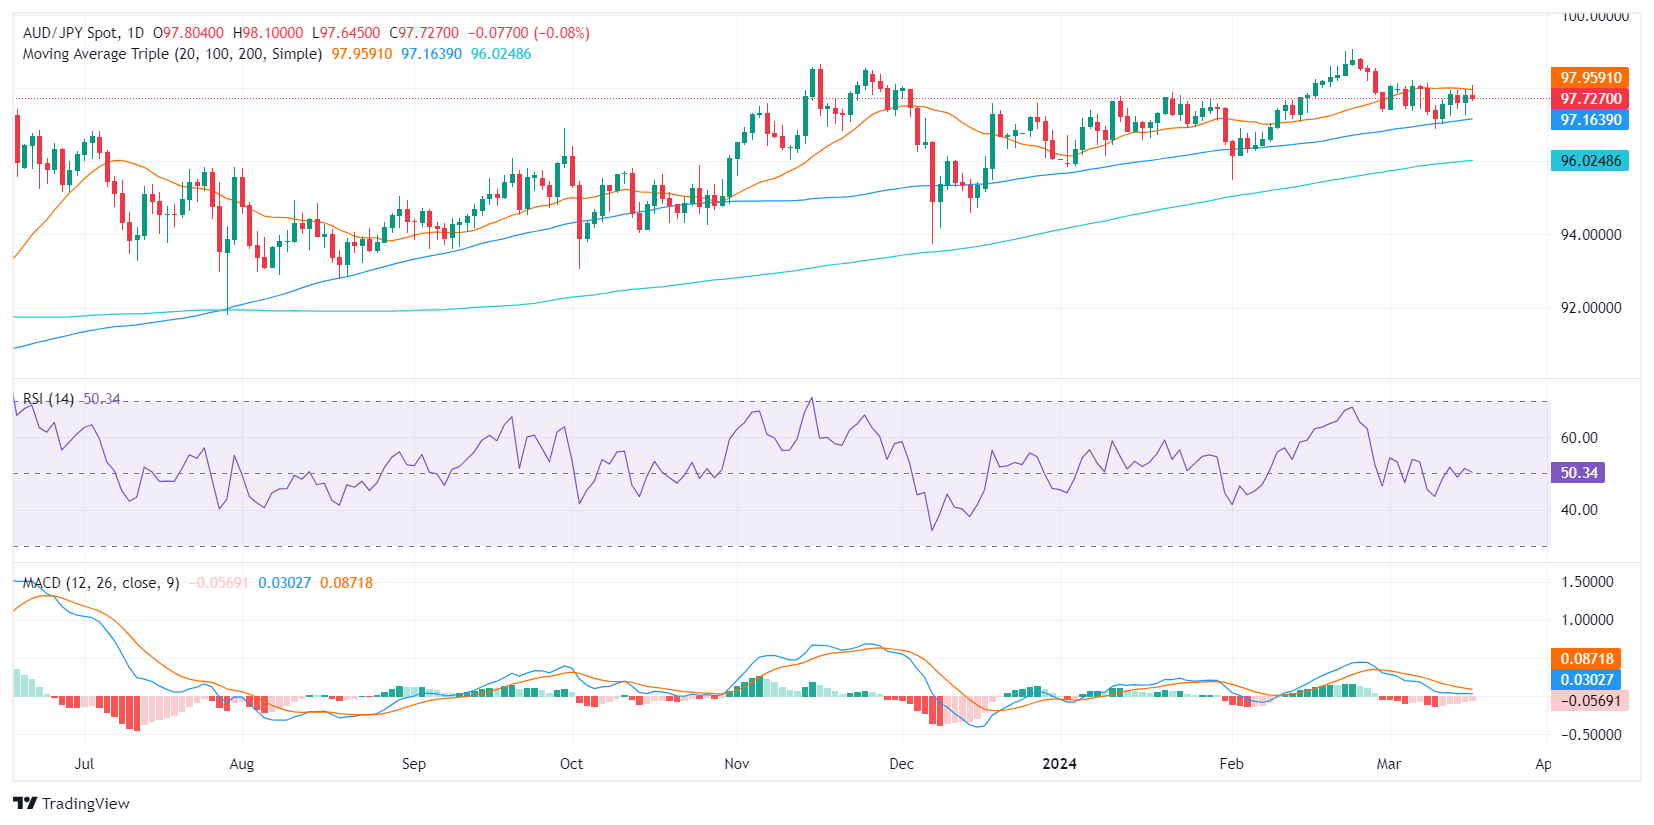
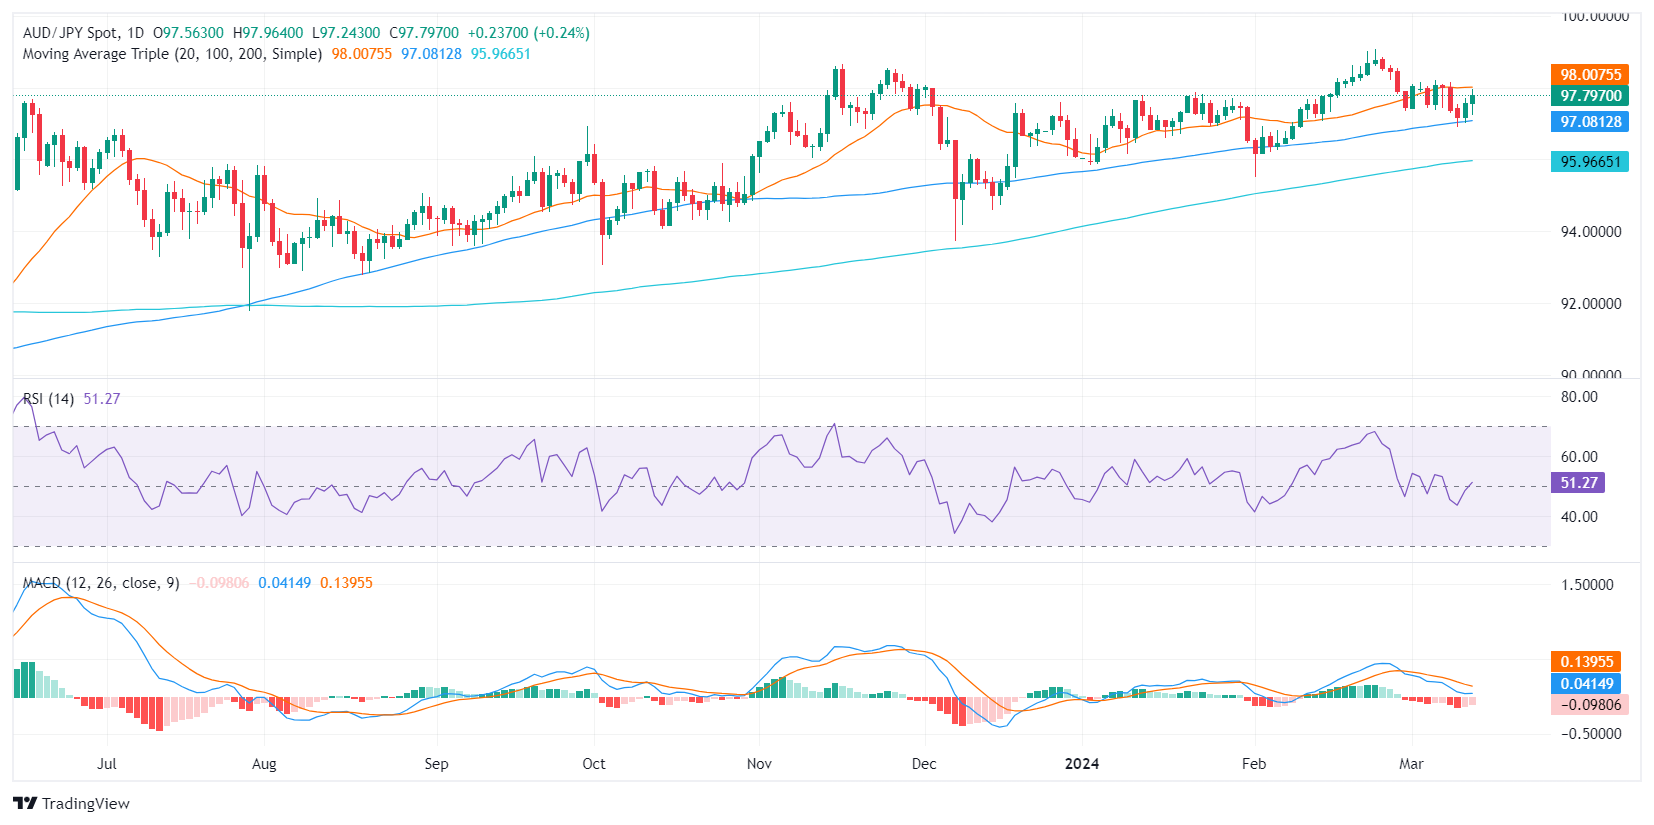
In Wednesday's session, the AUD/JPY was seen trading at around 97.75, recording a gain of 0.23%. The pair exhibits a bullish trend in the larger picture, managing to maintain its upward momentum beyond its benchmarks of the main Simple Moving Averages (SMAs) of 100 and 200 days. On the daily chart, bulls seem to have surged after days of losses, but there are signs of those movements being short-lived.
On the daily chart, the AUD/JPY's Relative Strength Index (RSI) has been clustering in positive territory, hovering at a recent high of 51.46 after an upward drift from sub-40 levels. In sync with the rising trajectory of the RSI, the Moving Average Convergence Divergence (MACD) histogram has flat red bars, indicating a weakening of the bearish momentum.
AUD/JPY daily chart
Switching gears to the hourly chart, the story is seemingly different. The RSI has consistently been trending near the overbought area, peaking at 68.42 and dipping to a low of 54.60. This characterizes a vibrant bullish sentiment in the shorter timeframe but with a sign of consolidation on the horizon. The MACD histogram echoes similar findings with rising red bars implying growing negative momentum with investors starting to take profits.
AUD/JPY hourly chart
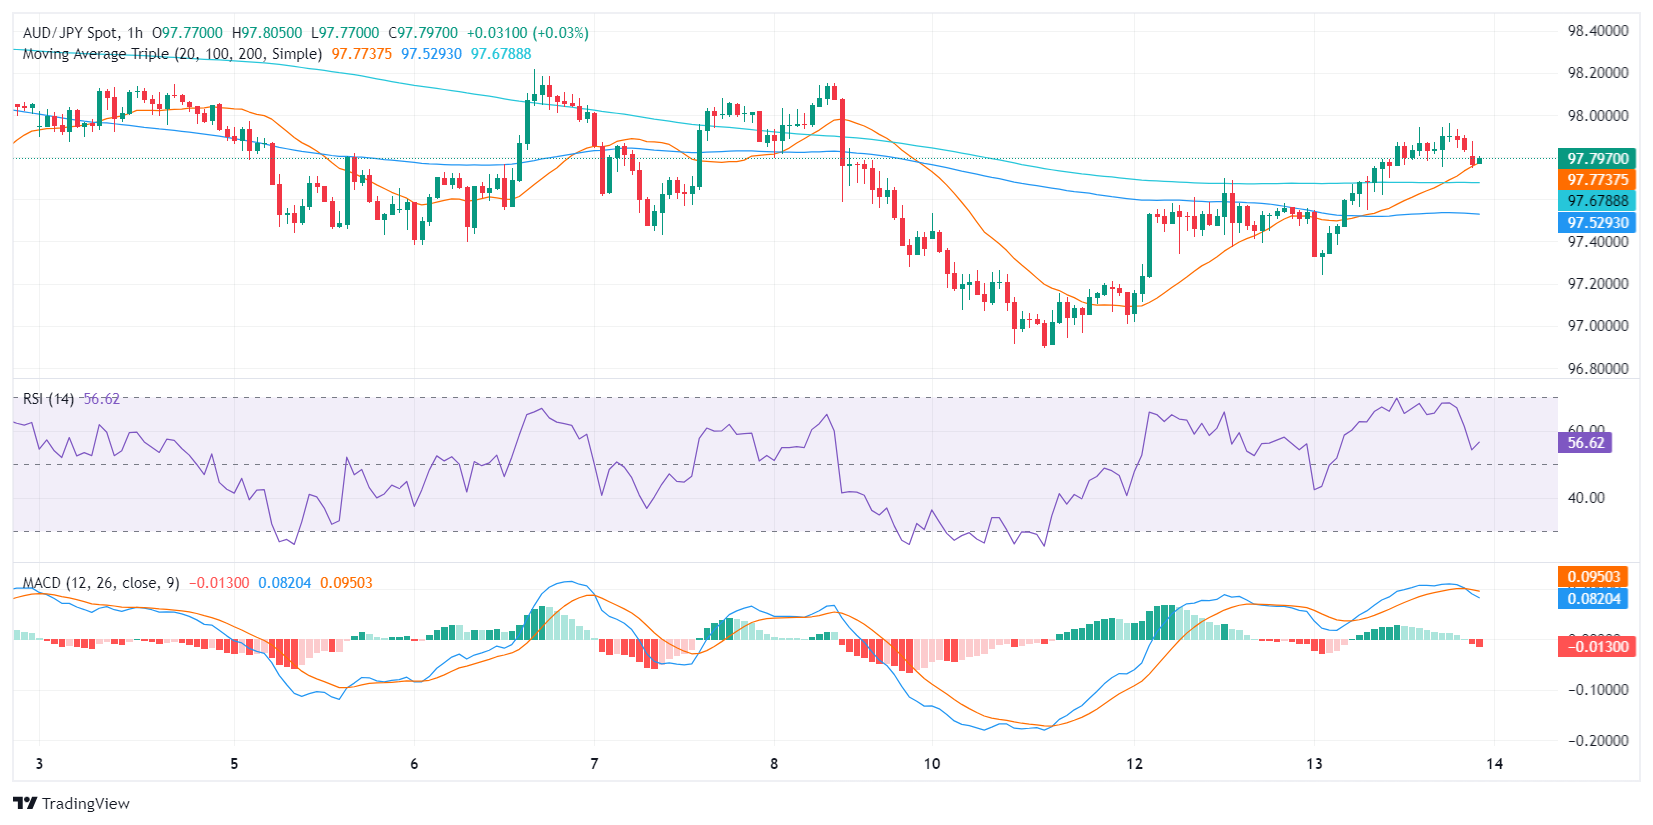
Overall, the bulls found some light, and tallied a two-day winning strike, after three days of losses. However, on the hourly chart, the bullish momentum rose near overbought levels which hints that the momentum is losing steam as investors are taking profits. Looking at the larger picture, the pair trading above the 100 and 200-day SMAs gives arguments of a bullish trend, but as long as it sits below the 20-day Average, the bears will still be around the corner.
-
13.03.2024 09:04AUD/JPY expands gains after recovering intraday losses, stretches higher to near 97.70
- AUD/JPY extends its gains for the second successive session on Wednesday.
- Australia's ASX 200 tracked the Wall Street gains overnight, shrugging off the stronger US Inflation data.
- Japanese firms have agreed to the demands for pay hikes of 5.85% in 2024.
AUD/JPY reverses its intraday losses and trades in positive territory for the second consecutive day on Wednesday, reaching levels near 97.70 during the European session. The AUD/JPY cross initially faced challenges during the Asian trading hours as the Japanese Yen (JPY) strengthened on market speculation suggesting that the Bank of Japan (BoJ) is considering an interest rate hike in March.
Moreover, the outcome of Japan's spring wage negotiations reveals that most firms have agreed to the wage rise demands put forth by the trade unions. Additionally, Japan's Chief Cabinet Secretary Yoshimasa Hayashi expressed his desire to witness widespread wage hikes across the economy.
Bank of Japan (BoJ) Governor Kazuo Ueda mentioned scrutinizing the wage talk outcome, as well as other data and information from our hearings, in making policy decisions. Ueda will consider tweaking the negative rate, YCC, and other monetary easing tools if the sustained achievement of our price target comes into sight.
The Australian Dollar (AUD) received upward support on Wednesday on higher S&P/ASX 200 Index, which has risen for the second consecutive day, following gains on Wall Street overnight. However, lower commodities' prices might have put pressure on the Aussie Dollar.
Concerns about a decrease in demand from China have led to a decline in iron ore futures. Additionally, there has been an increase in maintenance activities on blast furnaces among mills this week, indicating a potential decline in hot metal output.
-
12.03.2024 18:00AUD/JPY Price Analysis: Bulls recover traction, recovery may be incoming
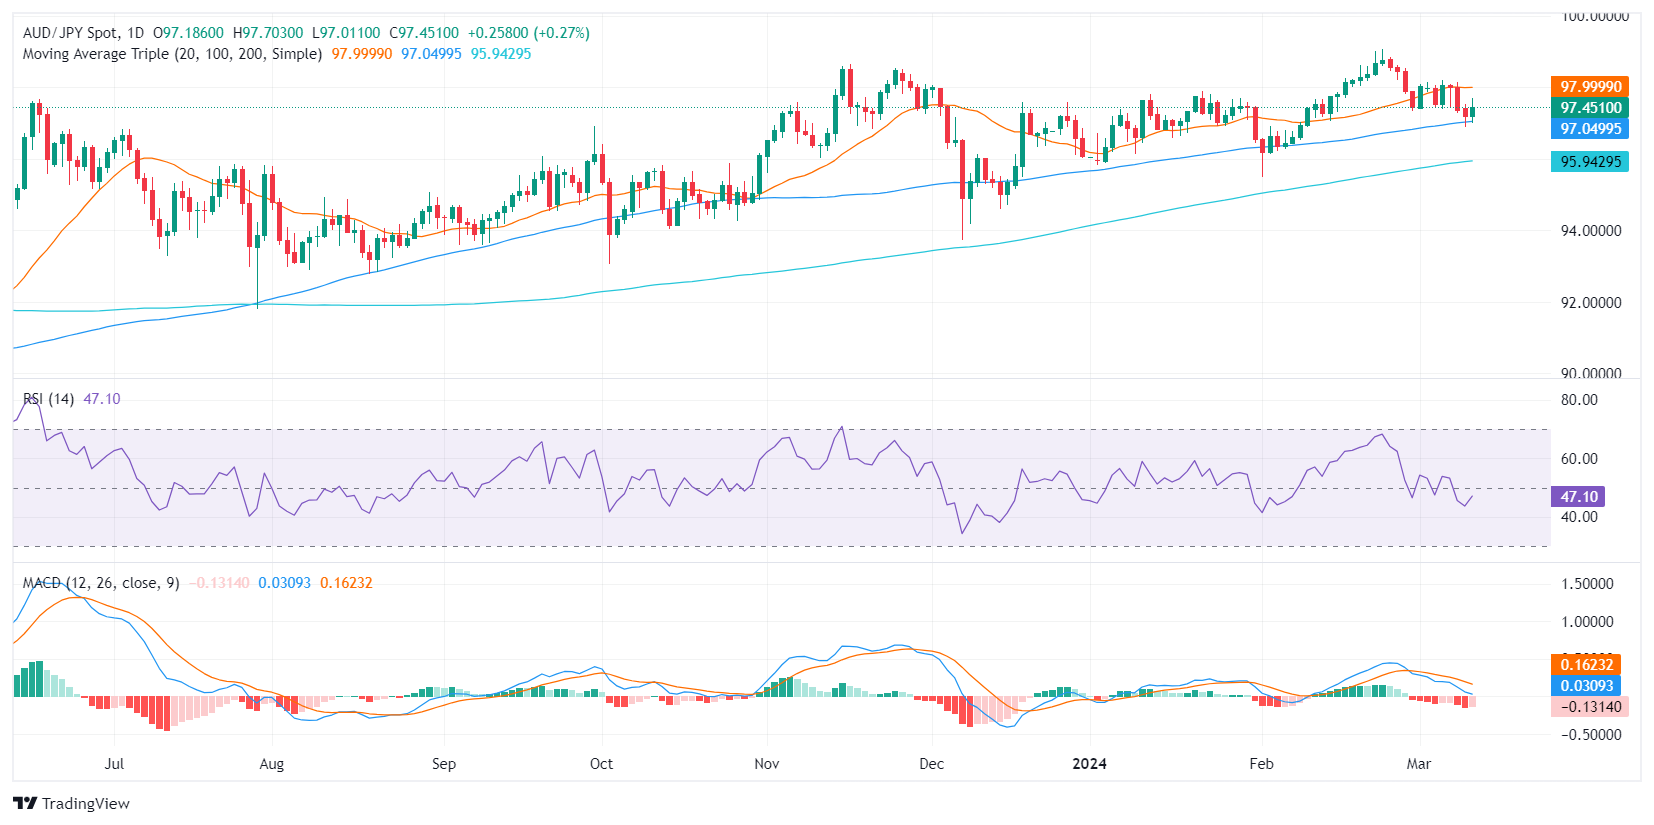
- The selling pressure dominates the daily chart, but indicators recovered on Tuesday.
- The hourly chart also depicts an improvement hinting at a potential recovery.
- With the operating above key SMAs, a longer-term bullish sentiment could potentially override recent bearish tendencies.
The AUD/JPY pair is trading at 97.477, showing a gain of 0.31%. Despite the gains, selling pressure seems to dominate in the short term but the overall trend remains bullish. Indicators are improving in the hourly chart.
Based on the indicators of the daily chart, the AUD/JPY pair shows a negative momentum as the Relative Strength Index (RSI) is currently in negative territory. Its rising slope however, suggests that the buyers are recovering The declining red bars in the Moving Average Convergence Divergence (MACD) histogram further emphasize this bearish momentum, signaling that sellers currently dominate the market but with a weakened grip.
AUD/JPY daily chart
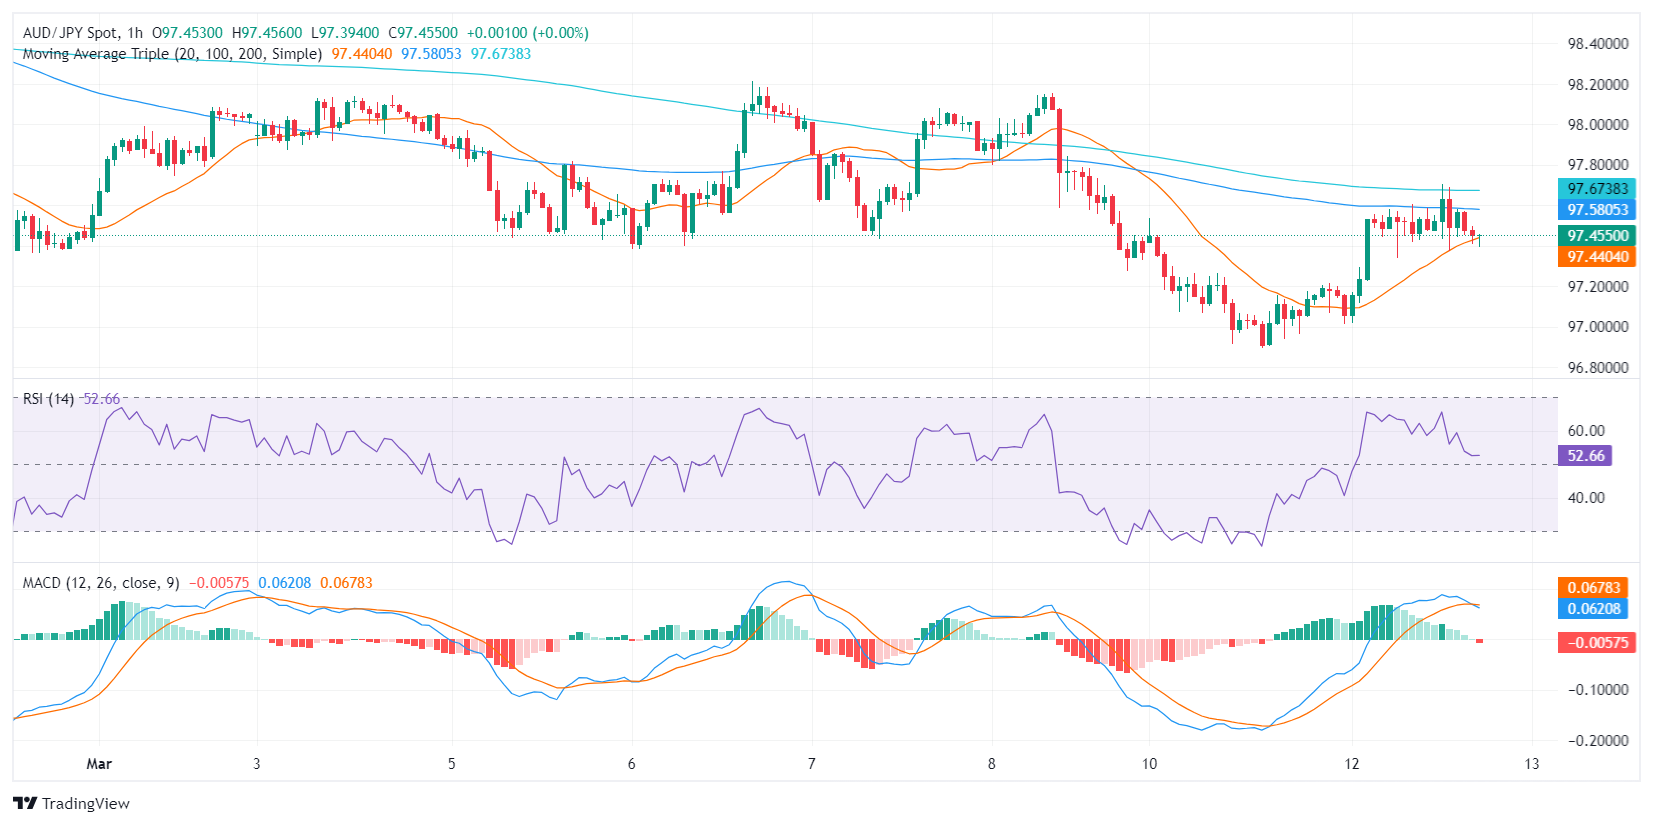
Transitioning to the hourly chart, the RSI stands in positive territory, illustrating a recovery in recent hours. The MACD histogram on the other hand printed a red bar, indicating that the resurge might be short-lived.
AUD/JPY hourly chart
Looking at the broader context, despite the short-term negative outlook, the AUD/JPY remains bullish as it trades above its 100, and 200-day Simple Moving Averages (SMAs). This suggests that the longer-term positive trend could still overshadow recent bearish movements. That being said, the buyers shouldn’t relax and must recover the 20-day average to resume its upward path.
-
11.03.2024 18:22AUD/JPY Price Analysis: Bears consolidate after hitting oversold conditions in the hourly chart
- The hourly RSI recovered after bottoming at oversold conditions.
- The negative outlook is more evident on the daily chart with bears threatening the 100-day SMA.
- As long as the bulls hold above the 100 and 200-day SMAs, the overall trend will remain bullish.
In Monday's session, the AUD/JPY pair commenced the week with a drop of 0.50%, trading around the 96.97 level. Bears are in command for the short term, but their momentum seems to fade. On the broader scale, the outlook remains bullish
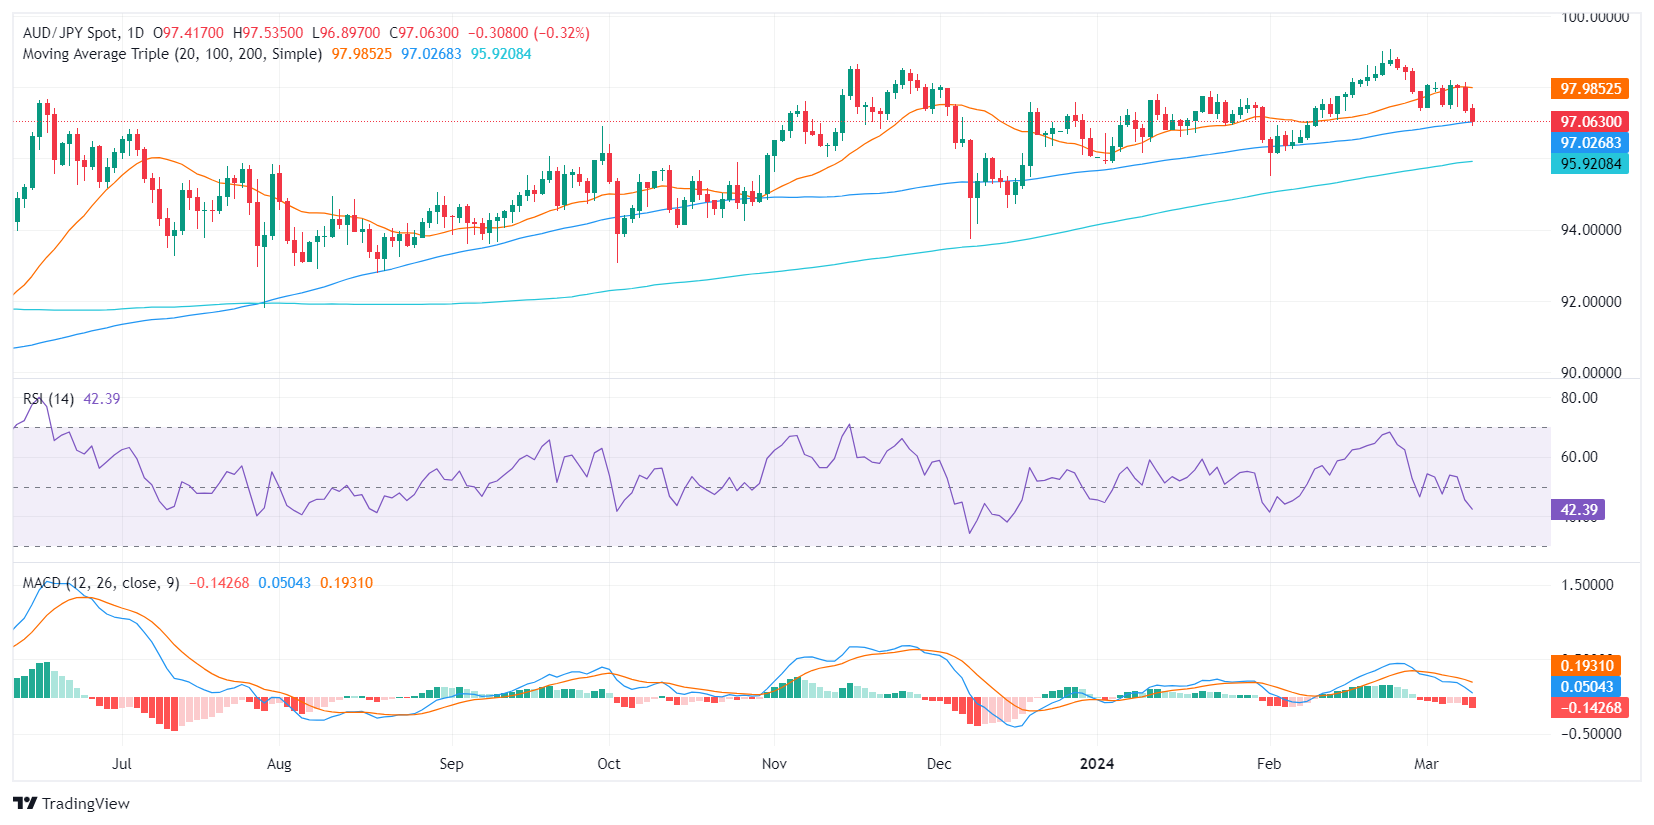
The AUD/JPY pair on the daily chart shows a negative outlook. The Relative Strength Index (RSI) remains deep in negative territory and seems to be en route to the oversold region. Meanwhile, the Moving Average Convergence Divergence (MACD) depicts rising red bars, suggesting an increased bearish momentum.
AUD/JPY daily chart
Shifting to the hourly chart, the RSI jumped back from a low of 30 as bears seemed to be consolidating their movements. The hourly MACD presents green bars on the rise, indicating a surge in positive momentum.
AUD/JPY hourly chart
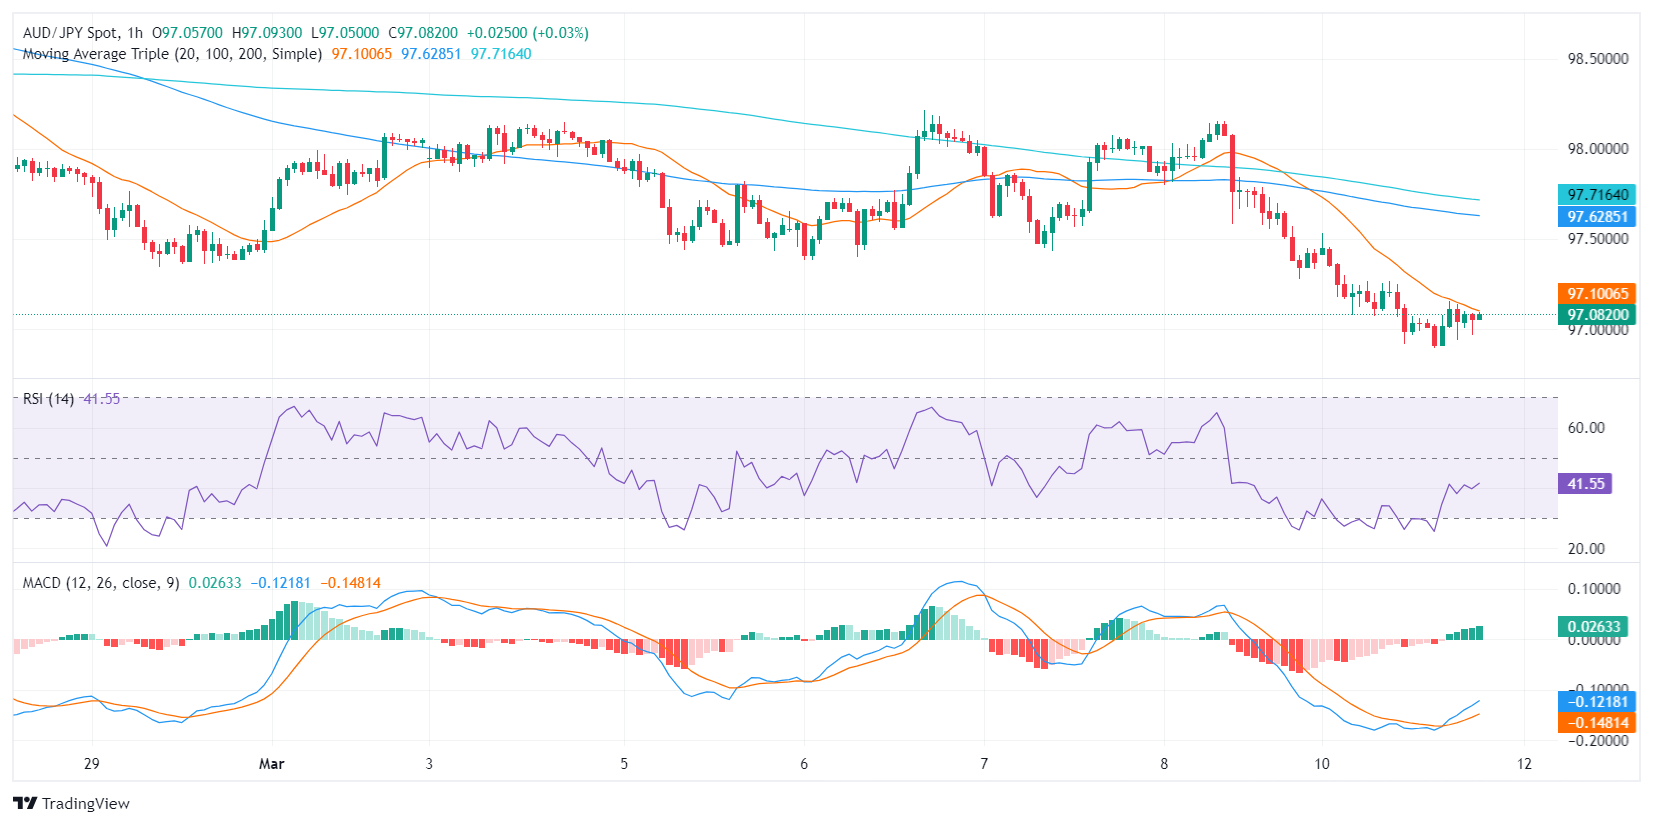
In conclusion, despite the short-term dominance of the bears, the selling momentum seems to be waning. This would give the buyers a chance to make an upward move. Meanwhile, the broader scale outlook, considering the pair's position above its 100 and 200-day SMAs, emphasizes overall bullish control despite trading below the 20-day average.
-
08.03.2024 18:17AUD/JPY Price Analysis: Bearish pressure intensifies, potential short-term rebound signalled
- The hourly chart portrays the RSI in the oversold territory, signaling a potential short-term rebound.
- On a broader perspective, the AUD/JPY remains above the main SMAs, indicating long-term bullish sentiment.
- The daily RSI is also in negative territory, showing increasing selling pressure.
- In the next sessions, the sellers may take a step back to consolidate their movements.
In Friday's session, the AUD/JPY pair is now trading at 97.49, demonstrating a loss of 0.38%. While the pair is currently dominated by sellers, oversold conditions seen on the hourly chart suggest that the pair may see some upside in the short term to consolidate.
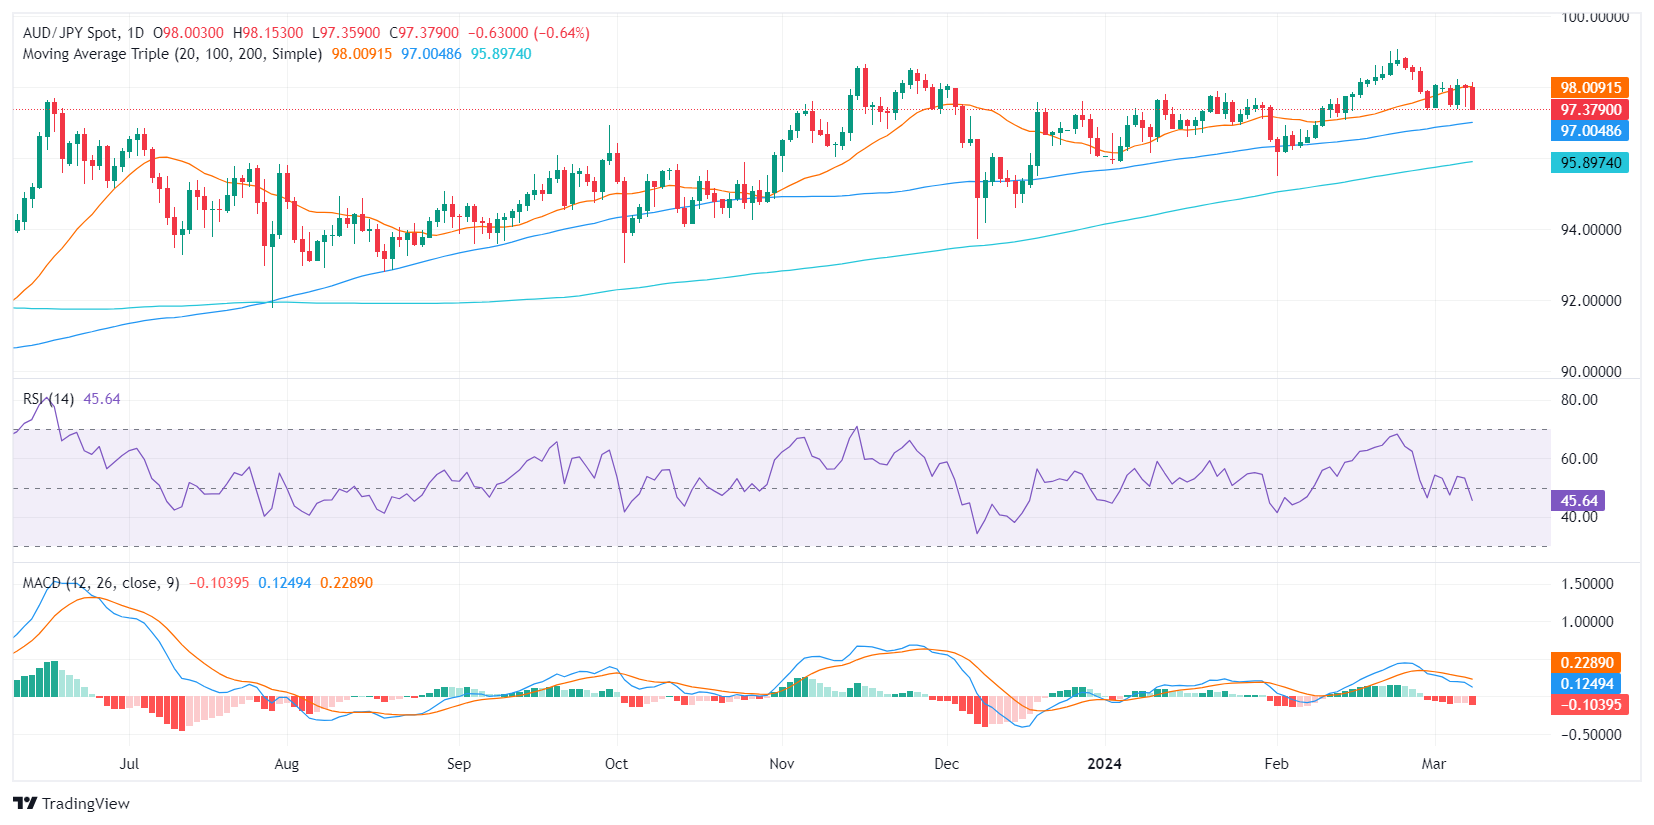
Analyzing the daily chart, the pair's Relative Strength Index (RSI) sits in negative territory, showcasing stronger selling momentum. In line with that, the Moving Average Convergence Divergence (MACD) histogram shows increasing negative momentum with rising red bars. Despite the ongoing bearish tendency, the pair manages to stay above the 100 and 200-day Simple Moving Averages (SMAs), which signifies a favorable condition for the bulls overall.
AUD/JPY daily chart
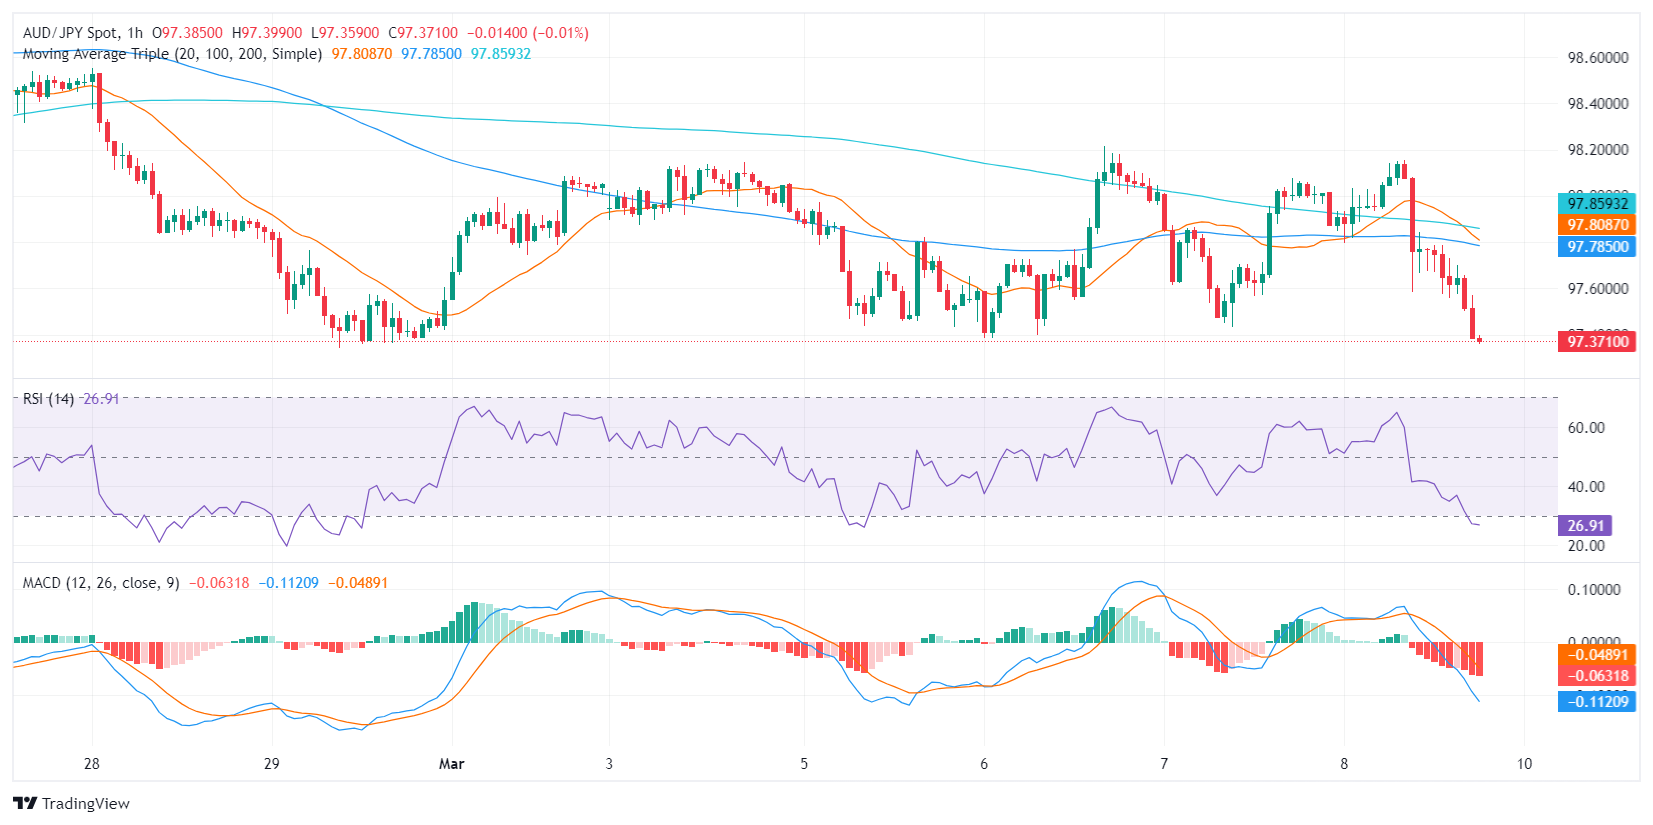
Zooming to the hourly chart, the RSI is currently located in the oversold territory, contrasting sharply with the daily chart, suggesting a possible short-term rebound due to oversold conditions. Likewise, the MACD illustrates increasing negative momentum on the hourly chart, aligning with the daily analysis. Despite differing conditions outlined in the hourly and daily charts, both depict dominant bearish forces, with bulls maintaining their stance in the broader spectrum and with the possibility of a bullish rebound in the short term.
AUD/JPY hourly chart
-
07.03.2024 17:53AUD/JPY Price Analysis: Bullish momentum builds, divergence risks loom
- A neutral outlook is seen on the daily chart.
- The hourly chart for AUD/JPY paints a different picture, showcasing mounting buying pressure.
The AUD/JPY pair is currently trading at 97.99, showcasing slight losses. The currency pair is experiencing a delicate dynamic between short-term buyers, who are starting to become more active, while on the daily chart, the outlook is mixed. However, the overall trend remains bullish as the pair hovers above key Simple Moving Averages (SMAs) of 20,100 and 200 days.
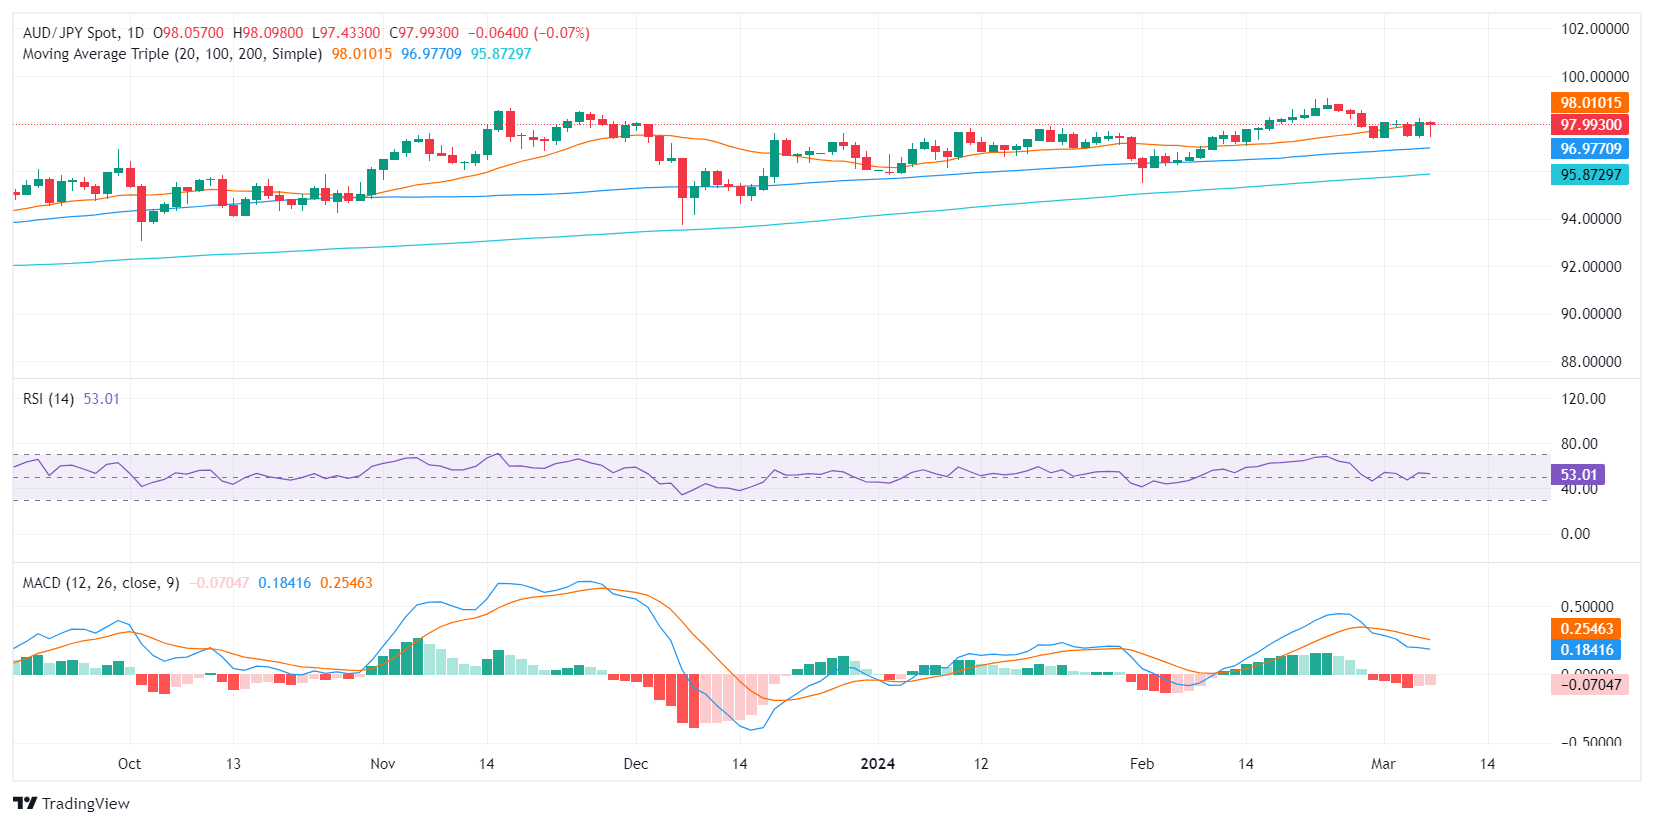
On the daily chart, the AUD/JPY pair is displaying a neutral momentum, underpinned by the Relative Strength Index (RSI) falling to negative territory this week. However, a slight increase was observed in the latest reading, suggesting a balanced market. Moreover, the fading red bars of the Moving Average Convergence Divergence (MACD) histogram indicate softening bearish momentum, casting doubt on the durability of the latest bearish move.
AUD/JPY daily chart
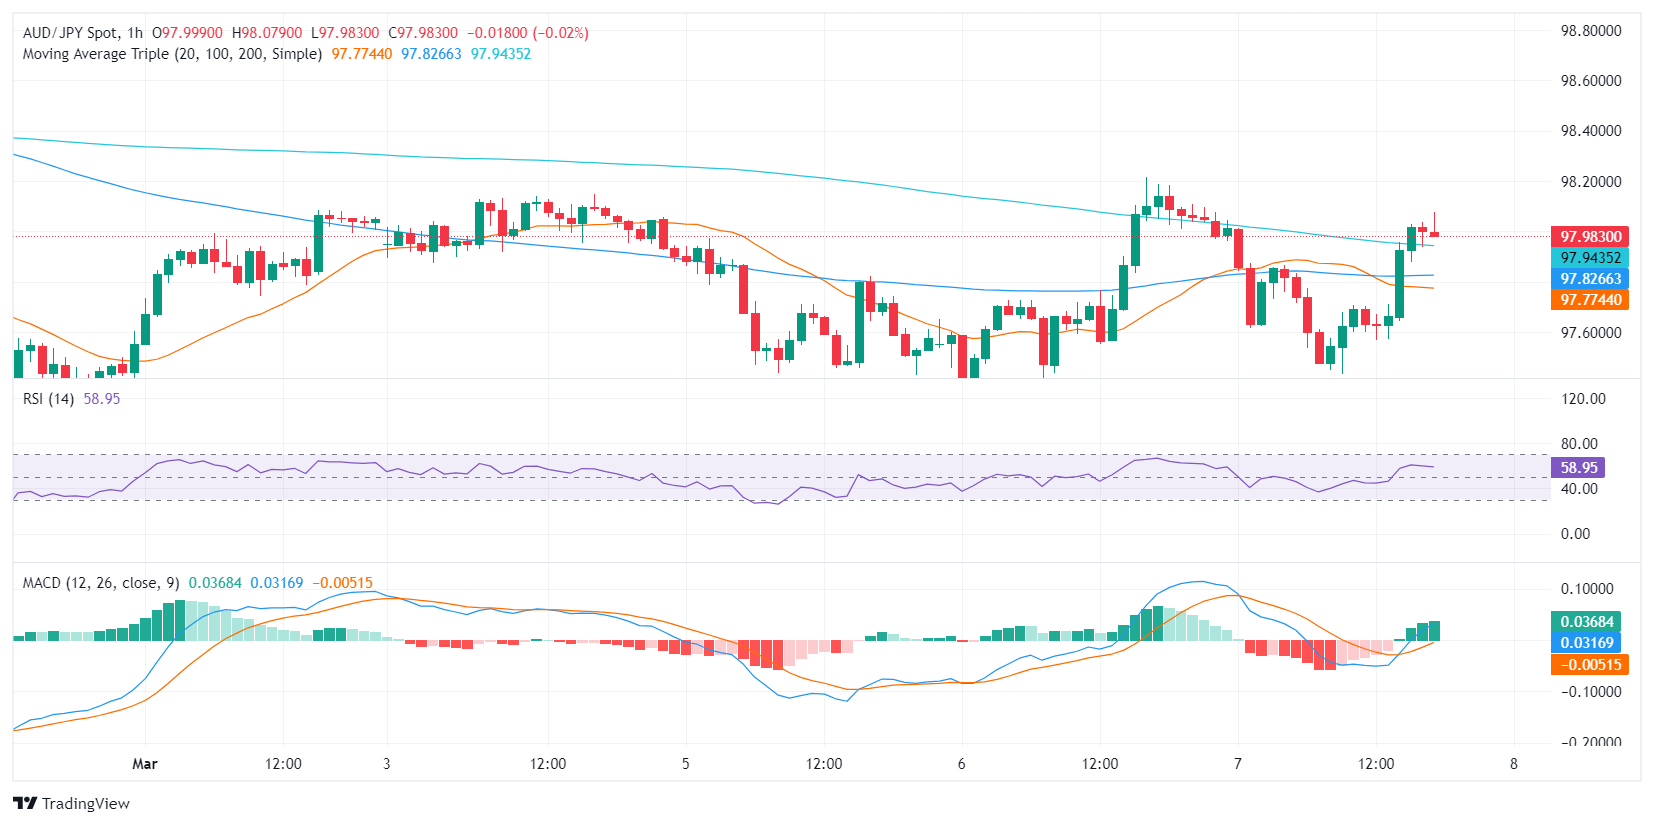
Taking a look at the AUD/JPY hourly chart, an interesting contrast comes into the picture. The recent positivity in the hourly Relative Strength Index (RSI), now within positive territory, underscores the mounting buying pressure at a granular level. Additionally, the rising green bars on the MACD histogram reveal escalating bullish momentum in this shorter timeframe, dispelling the cloud of bearishness cast by the daily chart.
AUD/JPY hourly chart
When combining daily and hourly views, it appears that the AUD/JPY is about to experience a period of consolidation after hitting multi-year highs in late February.
-
07.03.2024 09:25AUD/JPY depreciates on expectations of BoJ lifting negative rates, hangs near 97.50
- AUD/JPY loses ground on hawkish comments from BoJ officials on Thursday.
- Traders await the Japanese GDP Annualized due on Friday to gain further cues on the economy.
- Aussie Trade Balance (MoM) increased to 11,027M in February, lower than the expected 11,500M.
AUD/JPY plunges to near 97.50 during the European session on Thursday, retracing its recent gains registered in the previous session. The AUD/JPY cross lost ground after Bank of Japan (BoJ) Governor Kazuo Ueda mentioned that it is "fully possible to seek an exit from stimulus while striving to achieve the 2% inflation target." He also said that the extent of rate hikes would be determined by the situation at the time if negative rates are lifted.
BoJ policy board member Junko Nakagawa highlighted that the possibility of achieving the 2% inflation target sustainably is gradually improving. Nakagawa stressed the importance of scrutinizing data analysis duration for policy decisions. Additionally, Tuesday's data showed a rebound in the Tokyo Consumer Price Index (CPI) from a 22-month low in February. This has reignited discussions about the Bank of Japan potentially exiting the negative interest rates regime, thus bolstering the Japanese Yen against other currencies.
On the other side, the Australian Trade Balance showed that the surplus fell short of expected. The monthly data showed that the surplus increased to 11,027M in February, from 10,743M prior. The market expectation was an increase to 11,500M. Aussie Imports (MoM) increased by 1.3% in February, from the previous figure of 4.8%. Monthly Exports grew by 1.6%, exceeding the previous rise of 1.5%.
Australia's economy expanded less than expected in the fourth quarter, as shown by the latest Gross Domestic Product (GDP) data released on Wednesday. These softer numbers support the case for the Reserve Bank of Australia (RBA) to adopt an easing bias, which weakens the Australian Dollar (AUD) and, consequently, undermines the AUD/JPY cross.
Additionally, the positive Chinese Trade Balance data likely boosted the Australian Dollar, given Australia's close business ties with China. Additionally, the optimistic outlook for the Chinese economy could hinder the Japanese economy, thereby weakening the JPY and restricting losses in the AUD/JPY cross. China's Trade Balance for February surged to $125.16 billion, surpassing expectations of $103.7 billion and the previous figure of $75.34 billion. Additionally, year-on-year imports and exports increased by 3.5% and 7.1%, respectively. Japanese GDP Annualized for the fourth quarter of 2023 will be eyed on Friday.
-
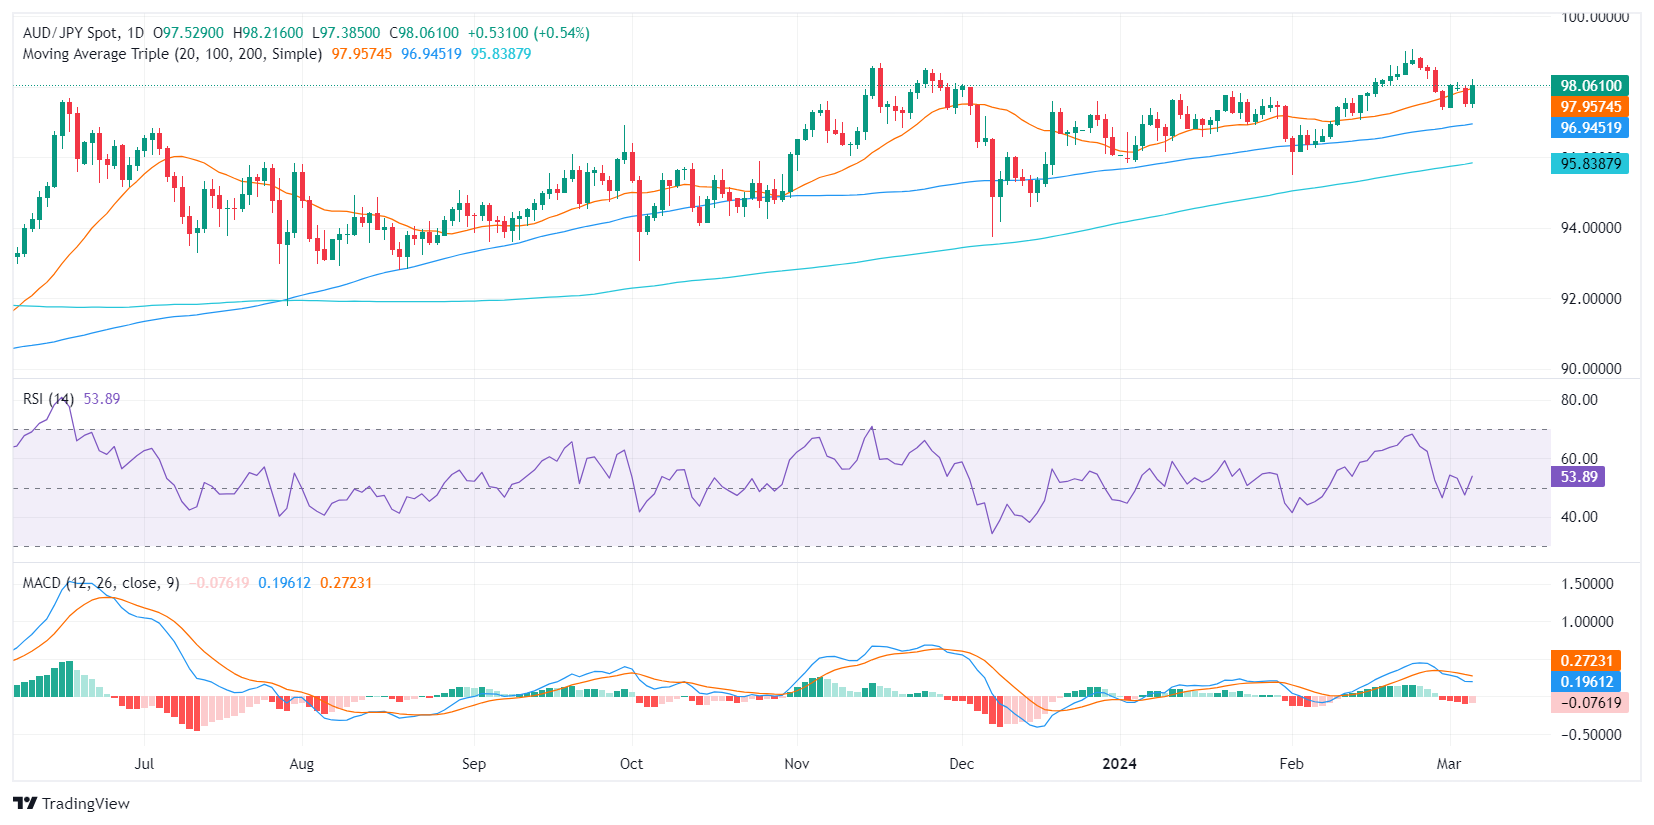
06.03.2024 19:31AUD/JPY Price Analysis: Bullish momentum signaled through short-term consolidation is on the horizon
- Building momentum is indicated by the RSI on the daily chart.
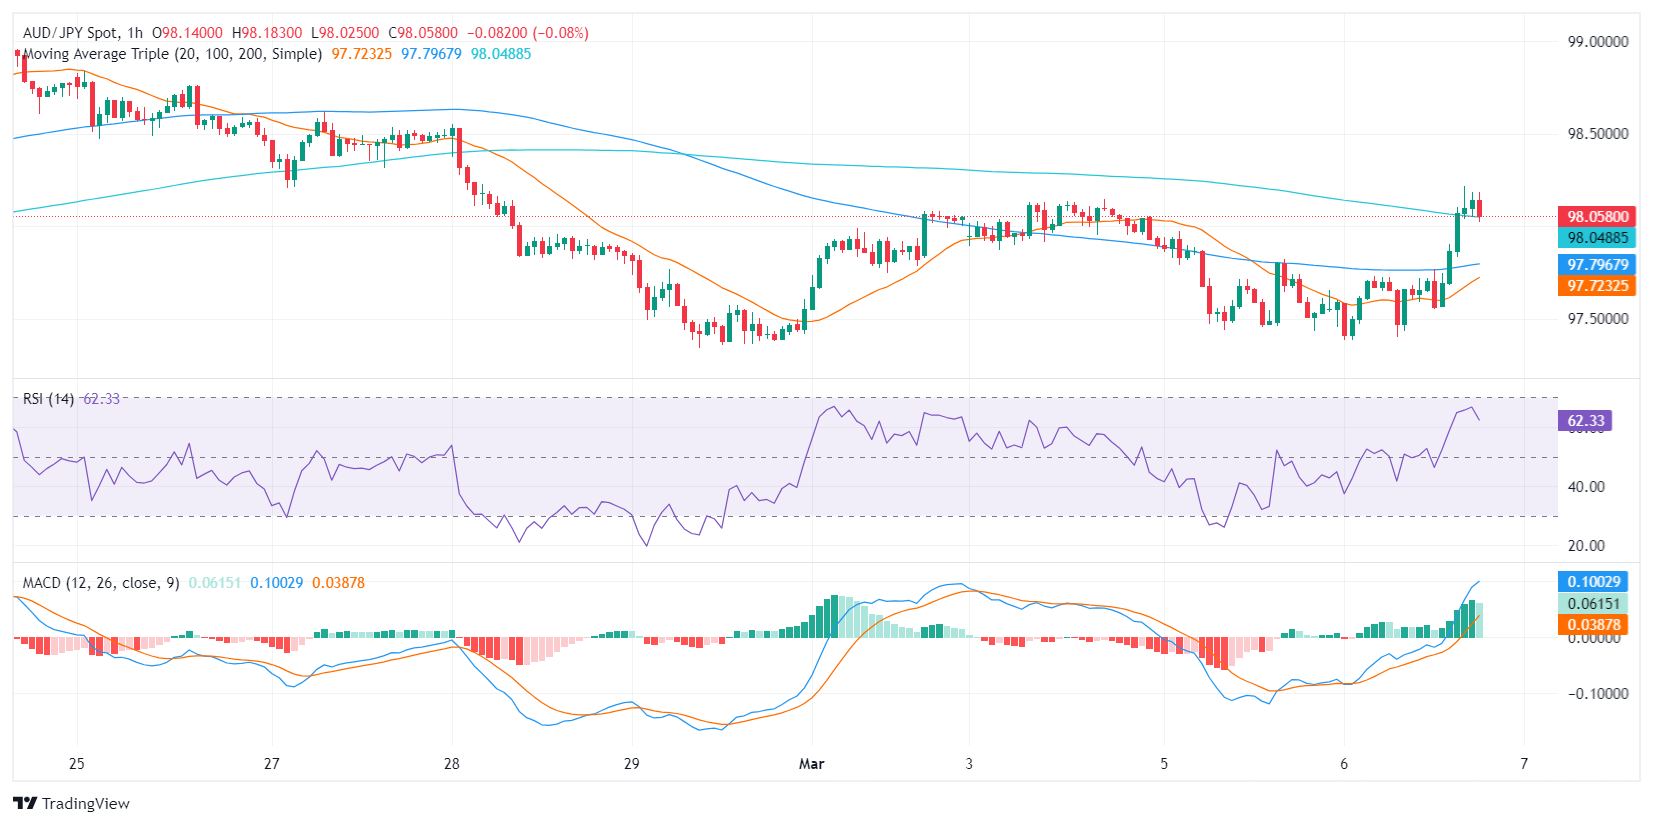
- The hourly chart also strengthens the positive outlook, with the presence of bullish momentum but hinting at a slight wobble.
- The pair recovered the 20-day SMA affirming the continued bullish sentiment.
During Wednesday's session, the AUD/JPY edged higher. The strength of the buyers primarily on the daily chart fuels this bullish sentiment. However, the hourly chart flashes signs of short-term contention, suggesting a potential consolidation for the rest of the session.
On the daily chart, the AUD/JPY pair indicates some bullish momentum. The Relative Strength Index (RSI) has moved into positive territory, which marks an upbeat momentum, with its latest reading standing slightly above the midpoint. Simultaneously, the Moving Average Convergence Divergence (MACD) histogram printing flat red bars indicates a decreasing bearish momentum in the short term.
AUD/JPY daily chart
Switching to the hourly chart, the RSI is treading in the positive region, confirming the bullish daily scenario. However, the index seems to be consolidating after nearing overbought conditions earlier in the session. In addition, the MACD histogram reveals decreasing green bars, suggesting the bullish momentum is waning on the hourly chart.
AUD/JPY hourly chart
In conclusion, both the daily and hourly charts suggest a bullish momentum, notwithstanding the short-term signs of a pullback. Given the pair's position being above the 20,100,200-day SMAs, the overall trend remains in favor of the buyers, unless a significant shift in momentum is seen.
-
06.03.2024 09:35AUD/JPY sticks to gains near 97.60 after recovering daily losses
- AUD/JPY recovers intraday losses on improved S&P/ASX 200 Index.
- Aussie GDP grew by 0.2% in Q4 2023, against the anticipated 0.3%.
- Attendees of the BoJ could advocate for lifting negative interest rates in the March meeting.
AUD/JPY reverses its daily losses on the improved ASX 200 Index and moves into the positive territory on Wednesday. The cross hovers around 97.60 during the European trading hours. During the Asian hours, the AUD faced downward pressure as the S&P/ASX 200 Index encountered challenges, reflecting a sell-off in technology stocks on Wall Street and lower mining stocks.
Despite softer-than-expected Gross Domestic Product (GDP) (Q4), the Australian Dollar remained relatively unaffected. The GDP grew by 0.2% quarter-on-quarter in the fourth quarter of 2023, slightly below market expectations of no change at 0.3%. However, on a year-on-year basis, GDP expanded by 1.5%, surpassing the expected 1.4%, albeit falling short of the previous growth of 2.1%.
The AUD/JPY cross could encounter resistance following reports from Jiji Press suggesting that attendees of the upcoming Bank of Japan (BoJ) policy meeting on March 19 may advocate for "lifting negative interest rates." However, BoJ Governor Kazuo Ueda expressed skepticism on Friday regarding the sustainability of Japanese inflation reaching the 2% target. With the unexpected possibility of a recession, the BoJ may delay its plans for monetary policy tightening.
According to Reuters, an unnamed source indicates that the BoJ is likely to maintain its forecast for a moderate economic recovery but may revise its assessment of consumption and factory output at the March meeting.
Tuesday’s data showed a rebound in the Tokyo Consumer Price Index (CPI) from a 22-month low in February. This development has reignited discussions about the possibility of the Bank of Japan (BoJ) exiting the negative interest rates regime, which, in turn, has bolstered the Japanese Yen.
-
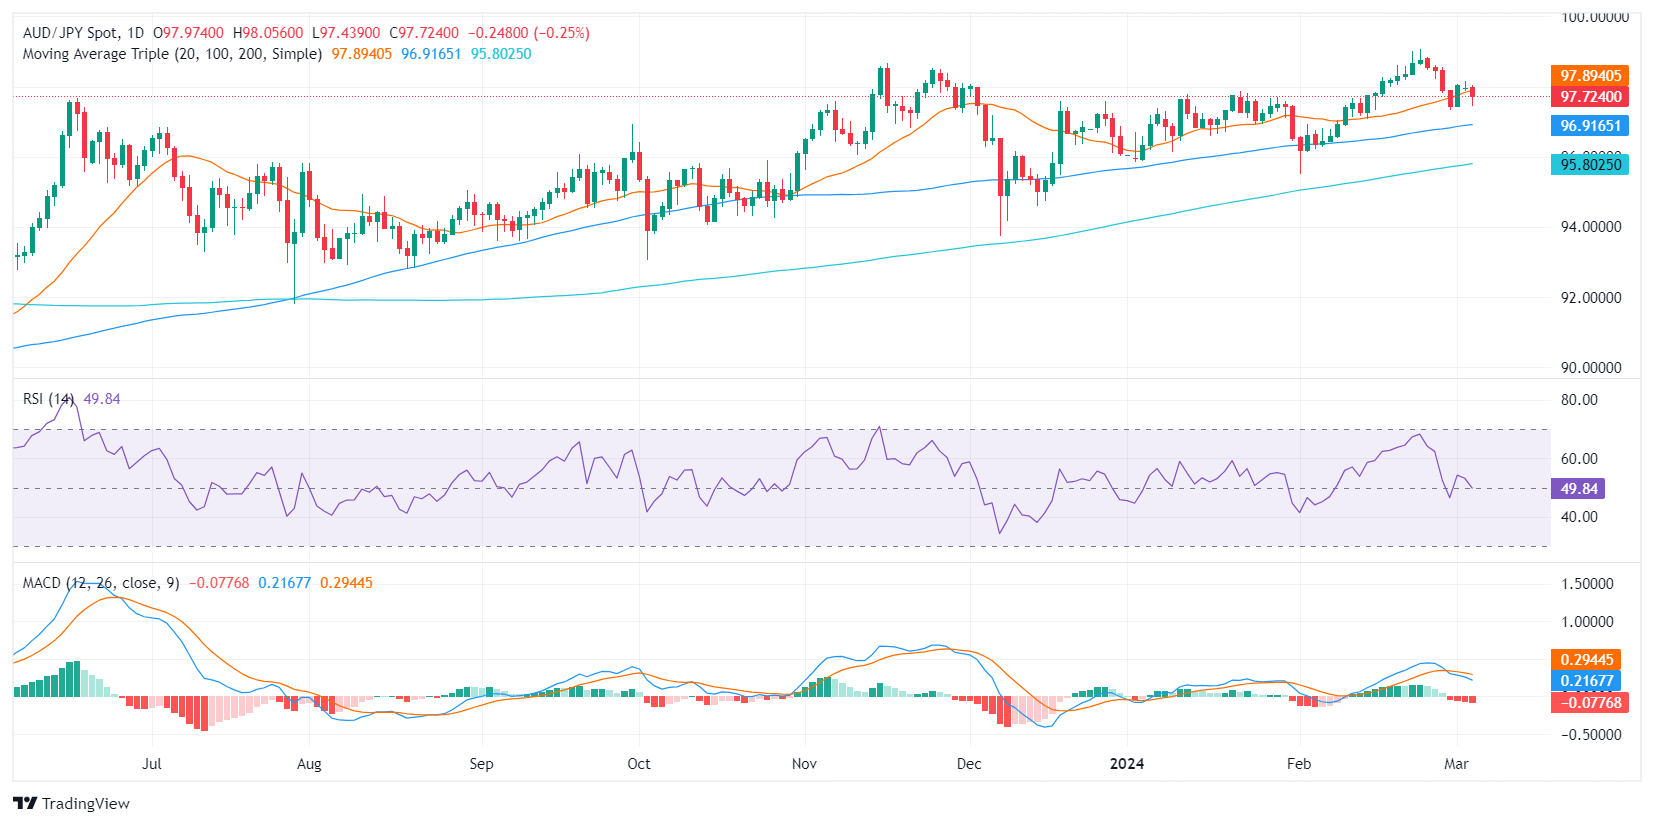
05.03.2024 18:22AUD/JPY Price Analysis: Bears consolidate after hitting oversold conditions on the hourly chart
- The AUD/JPY is trading down at 97.73 with losses in Tuesday’s session.
- Despite operating above the main SMAs, indicating long-term bullish sentiment, the short-term scenario is dominated by selling pressure.
- The daily RSI remaining pointing down, and MACD depicting an increase in red bars both signal growing selling momentum.
For Tuesday's session, AUD/JPY is exchanging hands at a level of 97.73, recording a minor decline of 0.19%. Despite the selling exertion evident on the daily chart, there appears to be a broader remains bullish as the pair continues trading above its main Simple Moving Averages (SMAs).
On the daily chart, the Relative Strength Index (RSI) for AUD/JPY remains in negative territory, while, the Moving Average Convergence Divergence (MACD) histogram is rising with red bars, indicating an increase in negative momentum.
AUD/JPY daily chart
Turning to the hourly chart, the RSI dipped into oversold territory earlier in the session, suggesting a strong bearish outlook very short term, and now the index recovered near its midline point suggesting that sellers are taking a breather. This view is corroborated by the rising green bars of the MACD.
AUD/JPY hourly chart
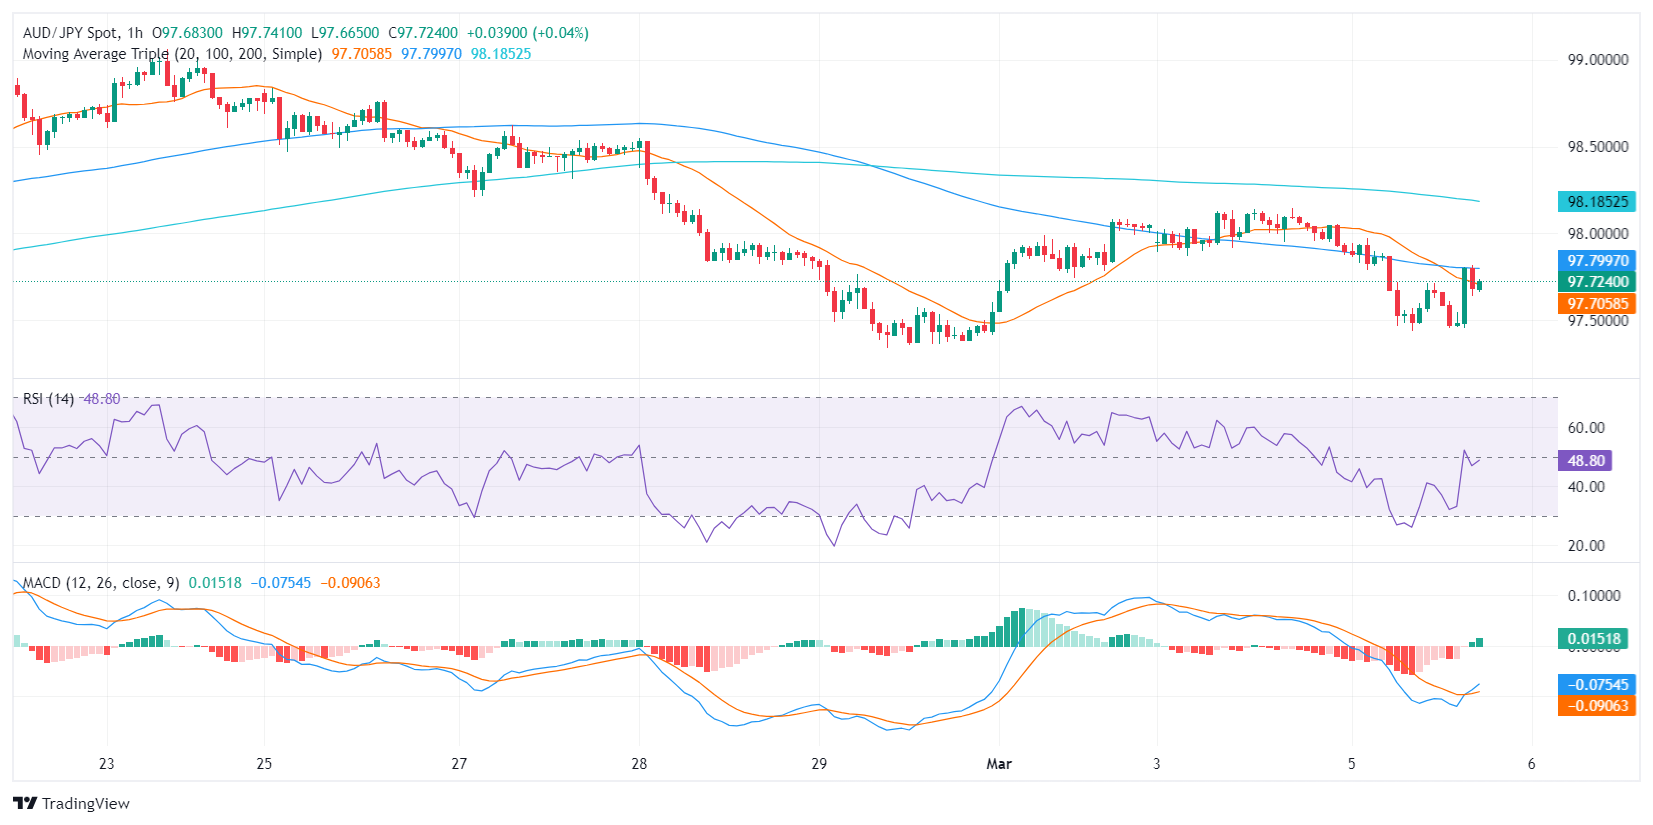
Overall, the AUD/JPY pair seems to be under selling pressure in the short term despite the broader bullish context suggested by its position above the 100 and 200-day SMAs. For the rest of the session, the pair may continue correcting oversold conditions hit earlier in the session.


© 2000-2024. All rights reserved.
This site is managed by Teletrade D.J. LLC 2351 LLC 2022 (Euro House, Richmond Hill Road, Kingstown, VC0100, St. Vincent and the Grenadines).
The information on this website is for informational purposes only and does not constitute any investment advice.
The company does not serve or provide services to customers who are residents of the US, Canada, Iran, The Democratic People's Republic of Korea, Yemen and FATF blacklisted countries.
Making transactions on financial markets with marginal financial instruments opens up wide possibilities and allows investors who are willing to take risks to earn high profits, carrying a potentially high risk of losses at the same time. Therefore you should responsibly approach the issue of choosing the appropriate investment strategy, taking the available resources into account, before starting trading.
Use of the information: full or partial use of materials from this website must always be referenced to TeleTrade as the source of information. Use of the materials on the Internet must be accompanied by a hyperlink to teletrade.org. Automatic import of materials and information from this website is prohibited.
Please contact our PR department if you have any questions or need assistance at pr@teletrade.global.
transfers