- Analytics
- News and Tools
- Quotes
- Chart and quotes for XAGUSD
Quotes and rates for precious metals Silver vs US Dollar (XAGUSD)
| Date | Rate | Change |
|---|
Related news
-
15.05.2024 20:24Silver Price Analysis: XAG/USD rallies sharply as bulls’ target $30.00
- Silver trades at $29.73, up over 3.80% after softer US CPI report.
- XAG/USD must surpass $29.79 and $30.00 for bullish momentum to continue.
- Key supports at $28.75 and $28.00 if prices fall below $29.00.
Silver’s rally continued Wednesday after a softer-than-expected Consumer Price Index (CPI) report in the United States (US) sent US yields tumbling, a tailwind for the precious metal. The XAG/USD trades at $29.73, up by more than 3.80% on the day.
XAG/USD Price Analysis: Technical outlook
Silver’s price surpassed the $29.00 and $29.50 psychological levels yet remains shy of cracking the year-to-date (YTD) high of $29.79. That left a double top looming, but momentum favors the buyers, as depicted by the Relative Strength Index (RSI).
The XAG/USD must clear the YTD high and the $30.00 psychological level for a bullish continuation. A breach of those levels will expose the February 2013 high at $32.15, followed by the October 2012 high at $35.40.
On the other hand, sellers need to drag Silver’s price below the $29.00 figure. In that outcome, the pull back could get to the May 18, 2021, high turned support at $28.75, followed by the $28.00 mark. Further losses lie below the latter, with key support seen at $27.00.
XAG/USD Price Action – Daily Chart

-
15.05.2024 08:23Silver Price Forecast: XAG/USD stays on sidelines around $28.60 ahead of US Inflation data
- Silver price exhibits strength amid soft US Dollar ahead of US CPI data.
- US consumer inflation remained stubbornly higher in the first three months of this year.
- US bond yields drop amid firm speculation that the Fed will pivot to policy normalization from September.
Silver price (XAG/USD) trades in a confined range around $28.60 in Wednesday’s European session. The white metal clings to gains inspired by the soft US Dollar, which fell sharply despite the release of the hot United States Producer Price Index (PPI) inflation report for April.
Annual PPI figures grew expectedly while monthly figures beat expectations. The US Dollar Index (DXY) dips sightly below 105.00. The appeal for dollar-denominated Silver improves due to soft Greenback. After the release of the PPI report, Federal Reserve (Fed) Jerome Powell commented that the overall data was mixed.
When asked about the inflation outlook, Powell ruled out the likelihood of more rate hikes but emphasized keeping the monetary policy restrictive for a longer period to bring inflation down. 10-year US Treasury yields drop further to 4.43% as traders remain confident that the Fed will start lowering interest rates from the September meeting. Generally, falling yields on interest-bearing assets reduce the opportunity cost of holding an investment in non-yielding assets, such as Silver.
Meanwhile, investors await the US Consumer Price Index (CPI) and monthly Retail Sales data for April, which will be published at 12:30 GMT. The economic indicators will significantly influence speculation for Fed rate cuts.
US consumer inflation has remained stubbornly higher in the first quarter of the year. A higher-than-projected US inflation report will deepen fears that the last mile to the 2% inflation road is significantly more persistent than what was previously anticipated.
Silver technical analysis
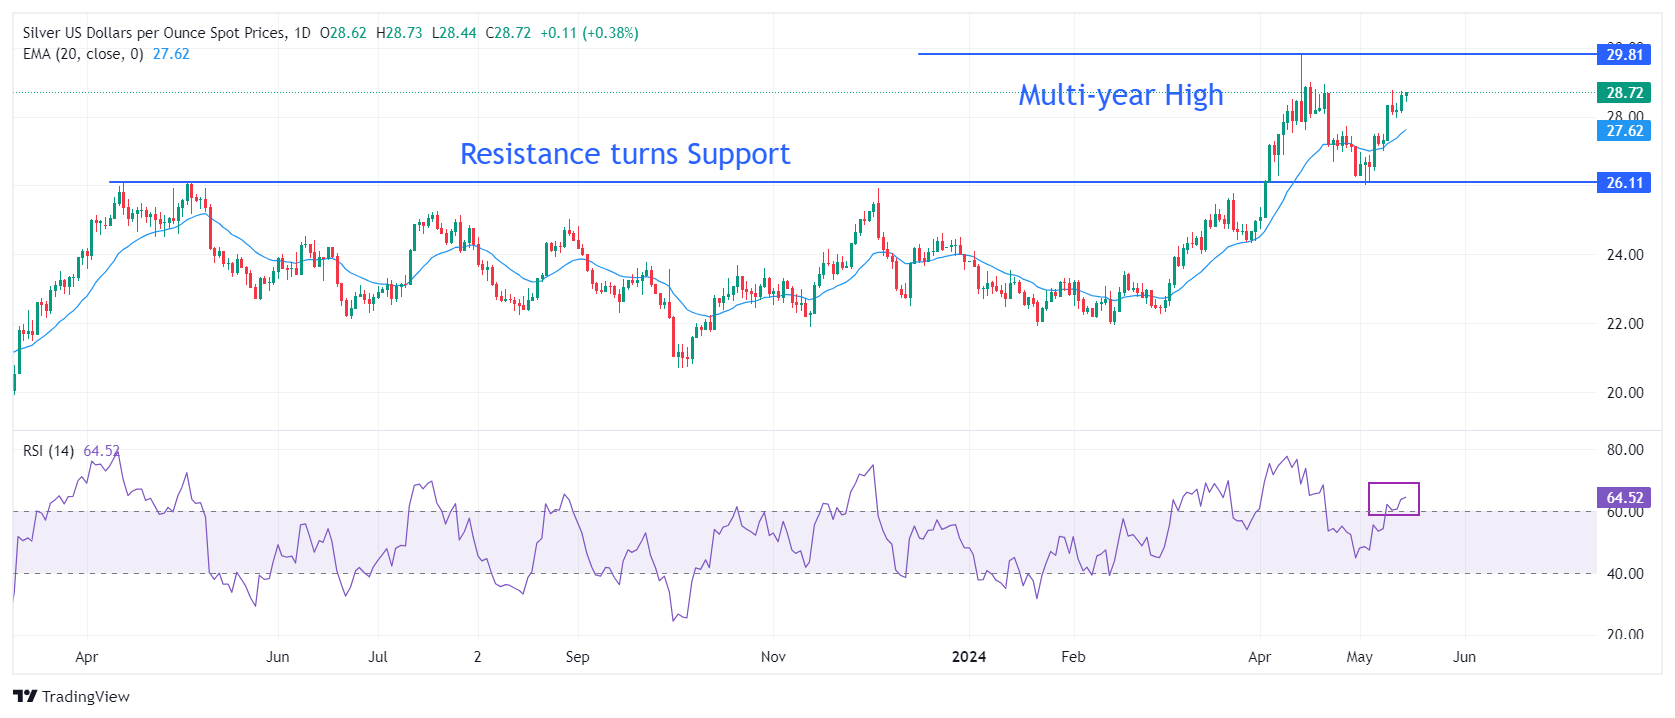
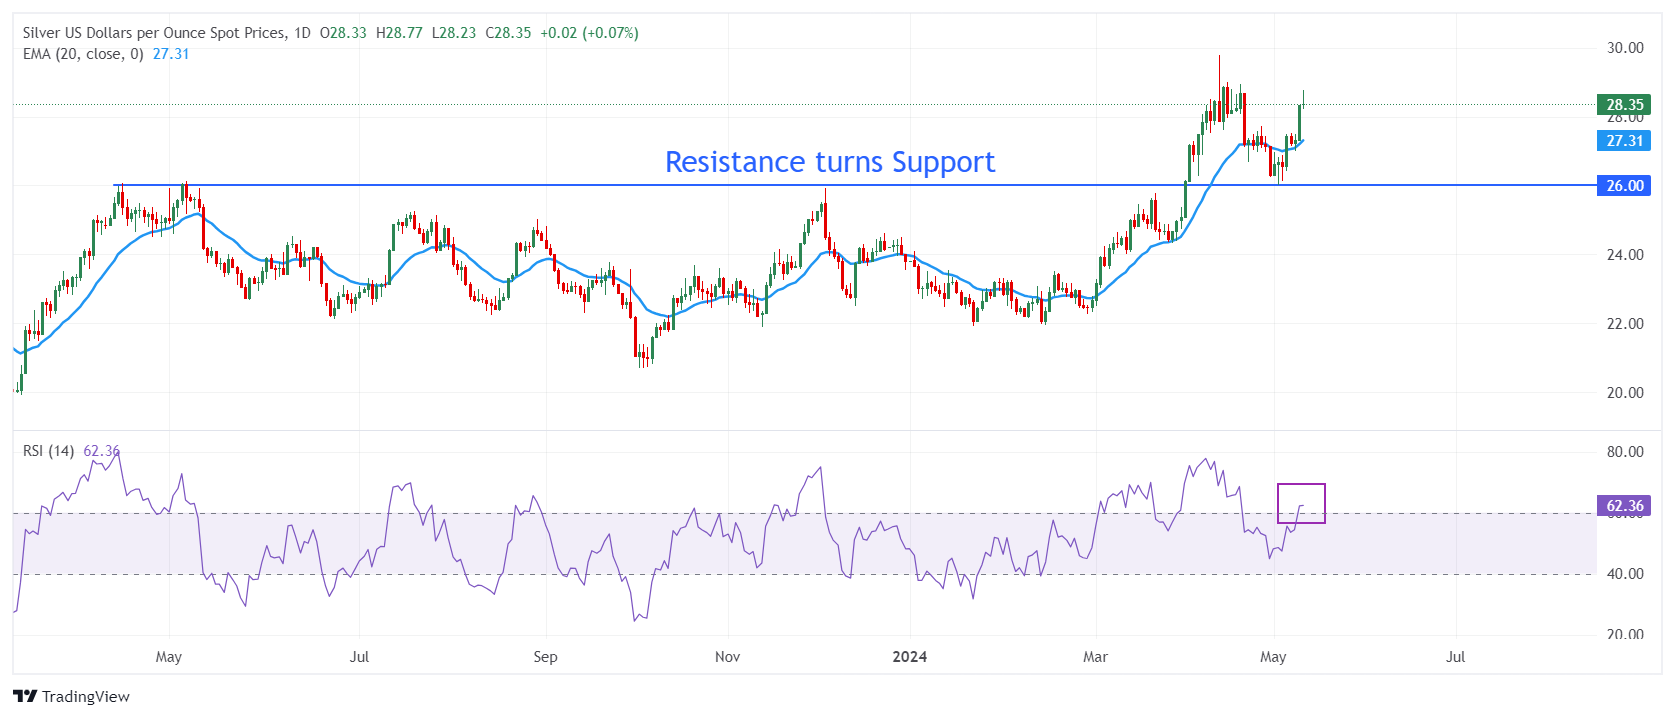
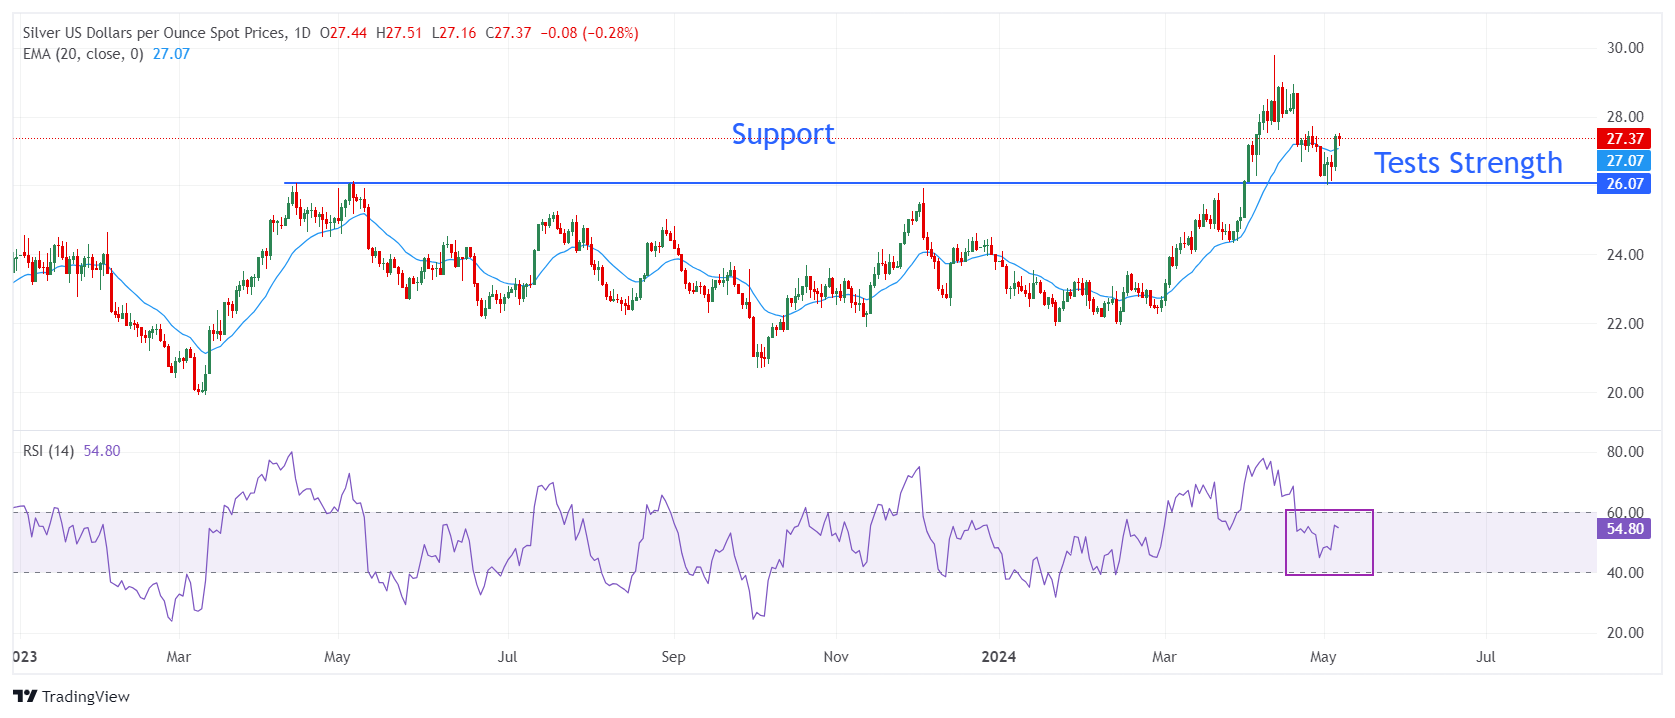
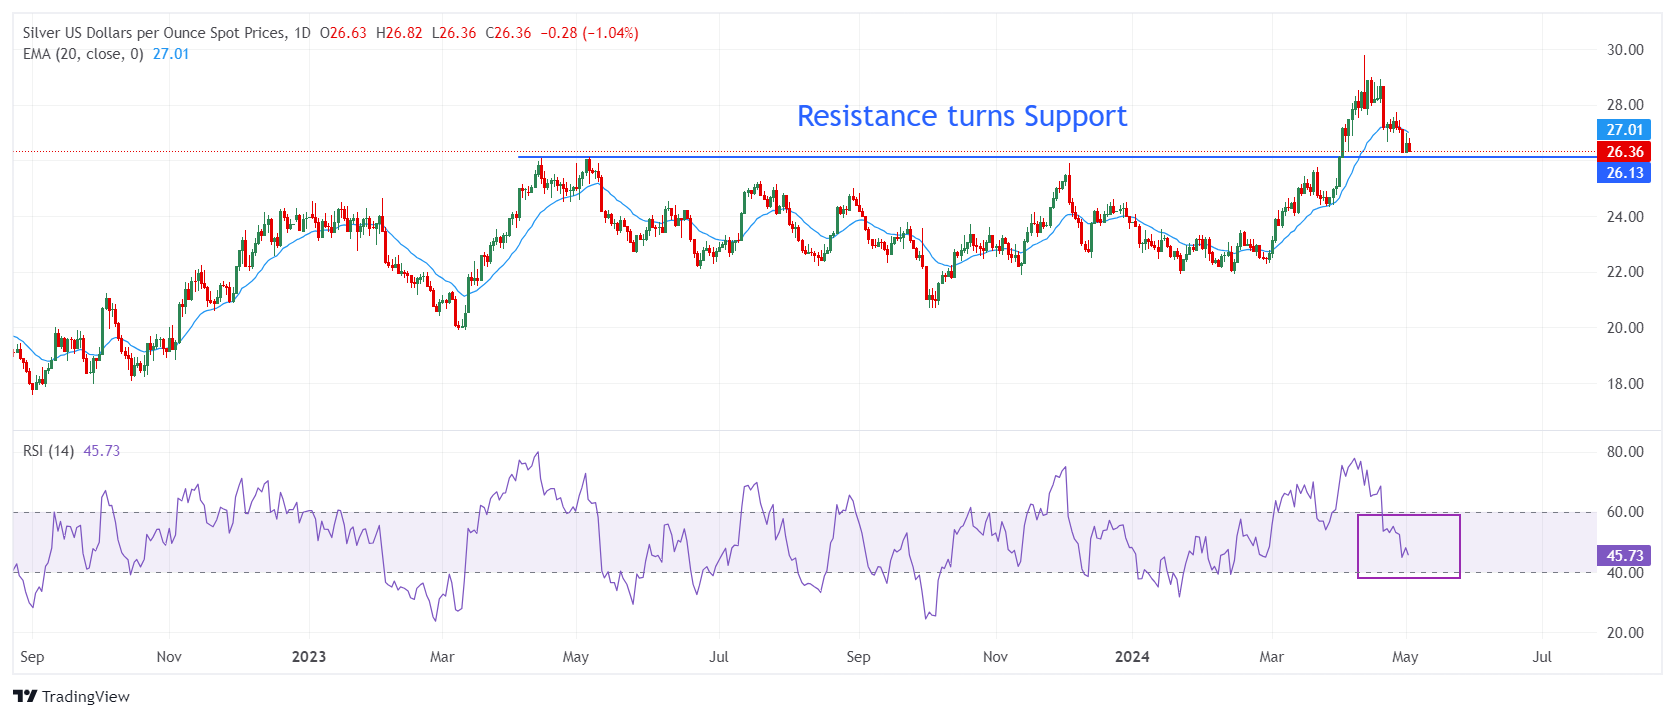
Silver price recovers sharply after discovering buying interest near the horizontal support plotted from 14 April 2023 high around $26.09 on a daily timeframe. The above-mentioned support was earlier a major resistance for the Silver price bulls. The white metal is approaching the multi-year high at $29.80.
The near-term outlook of Silver has improved as it returns above the 20-period Exponential Moving Average (EMA), which trades around $27.30.
The 14-period Relative Strength Index (RSI) shifts into the bullish range of 60.00-80.00, suggesting that a bullish momentum has been triggered.
Silver daily chart
Economic Indicator
Consumer Price Index ex Food & Energy (YoY)
Inflationary or deflationary tendencies are measured by periodically summing the prices of a basket of representative goods and services and presenting the data as the Consumer Price Index (CPI). CPI data is compiled on a monthly basis and released by the US Department of Labor Statistics. The YoY reading compares the prices of goods in the reference month to the same month a year earlier. The CPI Ex Food & Energy excludes the so-called more volatile food and energy components to give a more accurate measurement of price pressures. Generally speaking, a high reading is bullish for the US Dollar (USD), while a low reading is seen as bearish.
Read more.Next release: Wed May 15, 2024 12:30
Frequency: Monthly
Consensus: 3.6%
Previous: 3.8%
Source: US Bureau of Labor Statistics
The US Federal Reserve has a dual mandate of maintaining price stability and maximum employment. According to such mandate, inflation should be at around 2% YoY and has become the weakest pillar of the central bank’s directive ever since the world suffered a pandemic, which extends to these days. Price pressures keep rising amid supply-chain issues and bottlenecks, with the Consumer Price Index (CPI) hanging at multi-decade highs. The Fed has already taken measures to tame inflation and is expected to maintain an aggressive stance in the foreseeable future.
-
14.05.2024 20:24Silver Price Analysis: XAG/USD tests resistance at around $28.70 shy of reclaiming $29.00
- Silver rises 1.32% to $28.57, buoyed by lower US Treasury yields and a weakening dollar.
- XAG/USD shows strong upward trend within $28.00-$28.80 range, up from early May low of $26.02.
- To maintain momentum, silver aims to breach $29.00, targeting YTD high of $29.79 and $30.00.
- Support at $28.00; further supports at 38.2% Fib retracement ($27.70) and 50% Fib ($27.06).
Silver's price moved higher late in the North American session due to lower US Treasury yields and a softer US Dollar. Although the latest inflation figures in the US were higher than expected, the non-yielding metal climbed. The XAG/USD trades at $28.57, gains 1.32%.
XAG/USD Price Analysis: Technical outlook
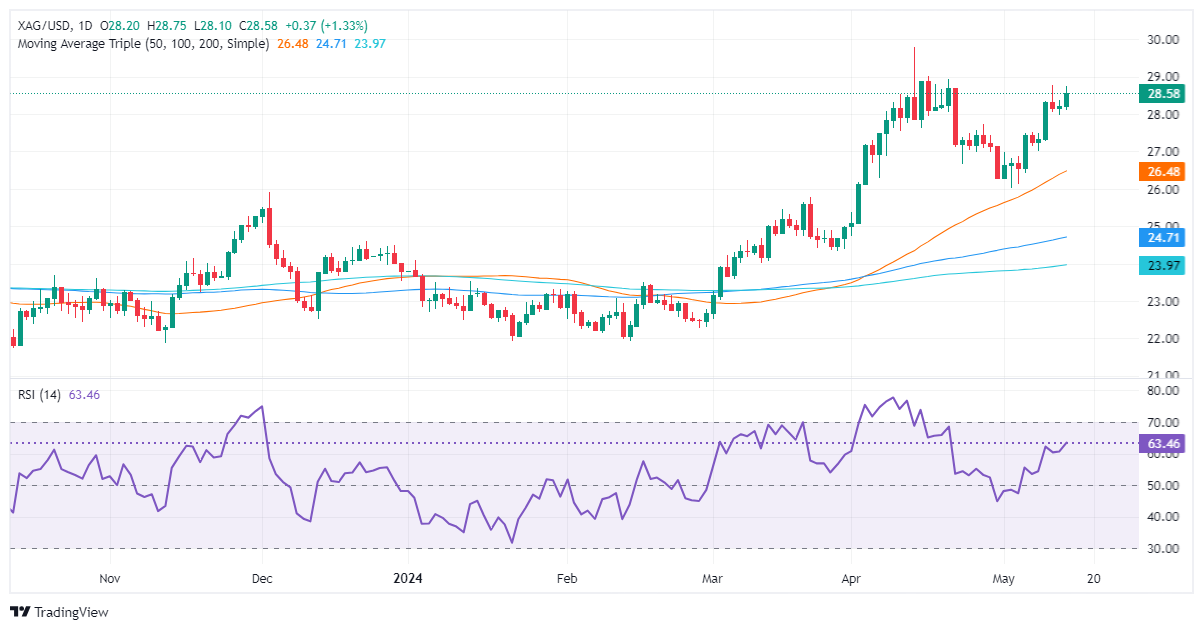
During the last three days, Silver has been seesawing within the $28.00-$28.80 range after registering exponential gains since May 2, which brought the grey metal’s price from around $26.02 to current spot prices.
XAG/USD is upward biased, though is at the brisk of forming a ‘double top.’ Momentum favors buyers, with the Relative Strength Index (RSI) standing at bullish territory.
For a bullish continuation, buyers need to reclaim the $29.00 psychological figure. Once cleared, the next stop would be the year-to-date (YTD) high at $29.79, followed by the $30.00 mark.
Conversely, if sellers stepped in and pushed prices below $28.00, look for further losses. The first demand zone would be the 38.2% Fib retracement at $27.70. A breach of the latter will expose the 50% Fib retracement at $27.06.
XAG/USD Price Action – Daily Chart
-
14.05.2024 14:17Silver Price Forecast: XAG/USD approaches two-week high of $28.80 with eyes on US Inflation data
- Silver price rises toward two-week high of $28.80 as US Dollar edges down.
- The US Dollar drops even though US PPI grew at a faster rate in April.
- The Fed could delay rate cuts beyond September.
Silver price (XAG/USD) jumps higher to $28.60 in Tuesday’s New York session. The white metal strengthens as the US Dollar drops despite the United States Bureau of Labor Statistics (BLS) has published a stubborn Producer Price Index (PPI) report.
Monthly headline PPI grew at a faster rate of 0.5% from the estimates of 0.3%, suggesting price pressures remained persistent at the start of the second quarter. The Core PPI that excludes volatile food and energy prices also rose by 0.5%. Annual headline and the core PPI data grew in line with estimates of 2.2% and 2.4%.
This has deepened fears about the Federal Reserve (Fed) delaying rate cuts beyond September or keeping interest rates in their current range of 5.25%-5.50% for the entire year. The US Dollar Index (DXY), which tracks the US Dollar’s value against six major currencies, falls to 105.00. The appeal for dollar-denominated Silver improves when the Greenback edges down.
10-year US Treasury yields fall further to 4.46%. Generally, deepening risks of persistent inflation boost yields on interest-bearish assets. However, in this case, bond yields have fallen. This has diminished the opportunity cost of holding an investment in non-yielding assets, such as Silver.
This week, the US Consumer Price Index (CPI) data for April will be the major economic indication that will help investors to project the next move in the Silver price, US Dollar and the bond yields, which will be published on Wednesday. Investors will also focus on the monthly Retail Sales, which will be published along with the consumer inflation data.
Silver technical analysis
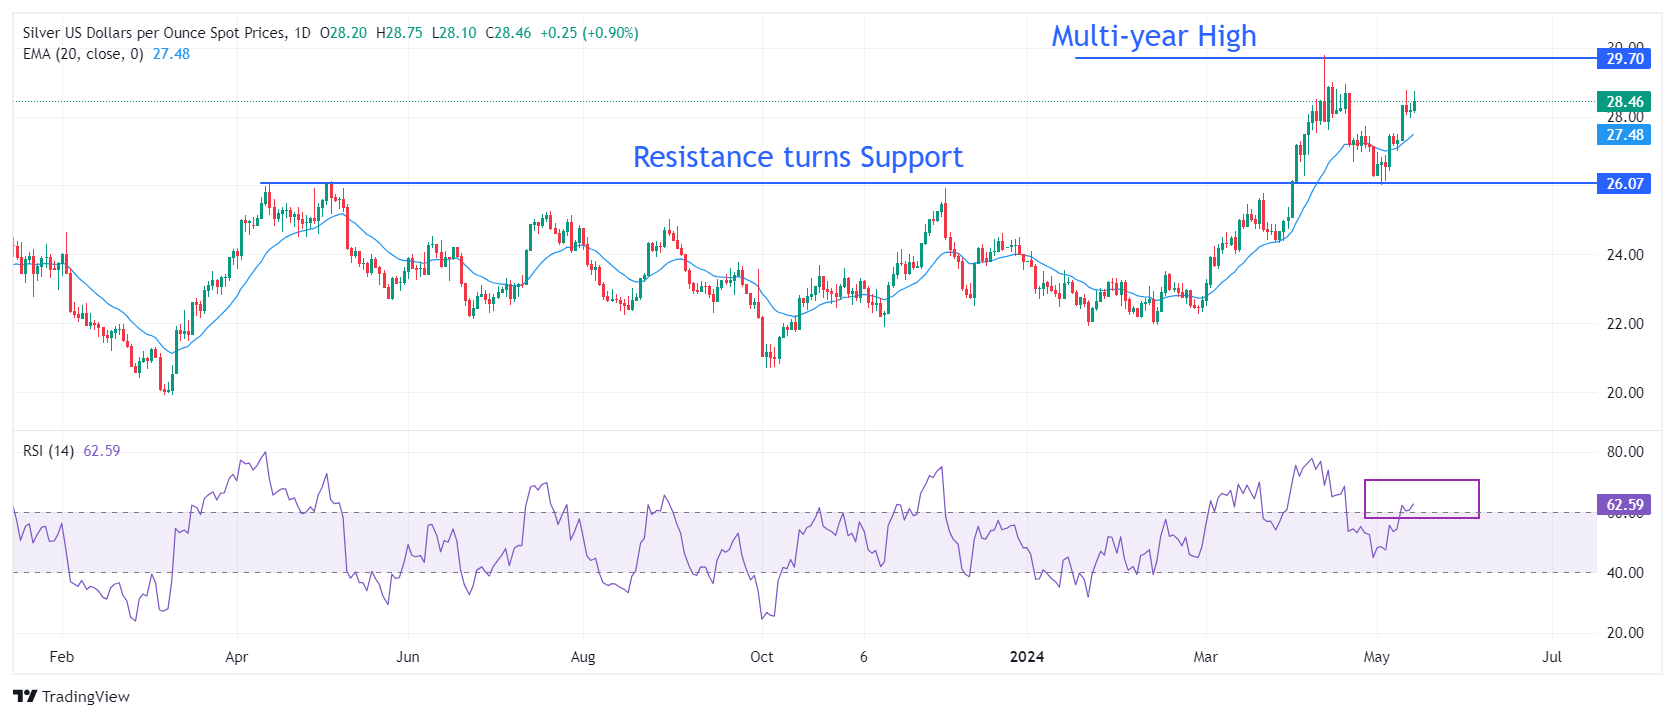
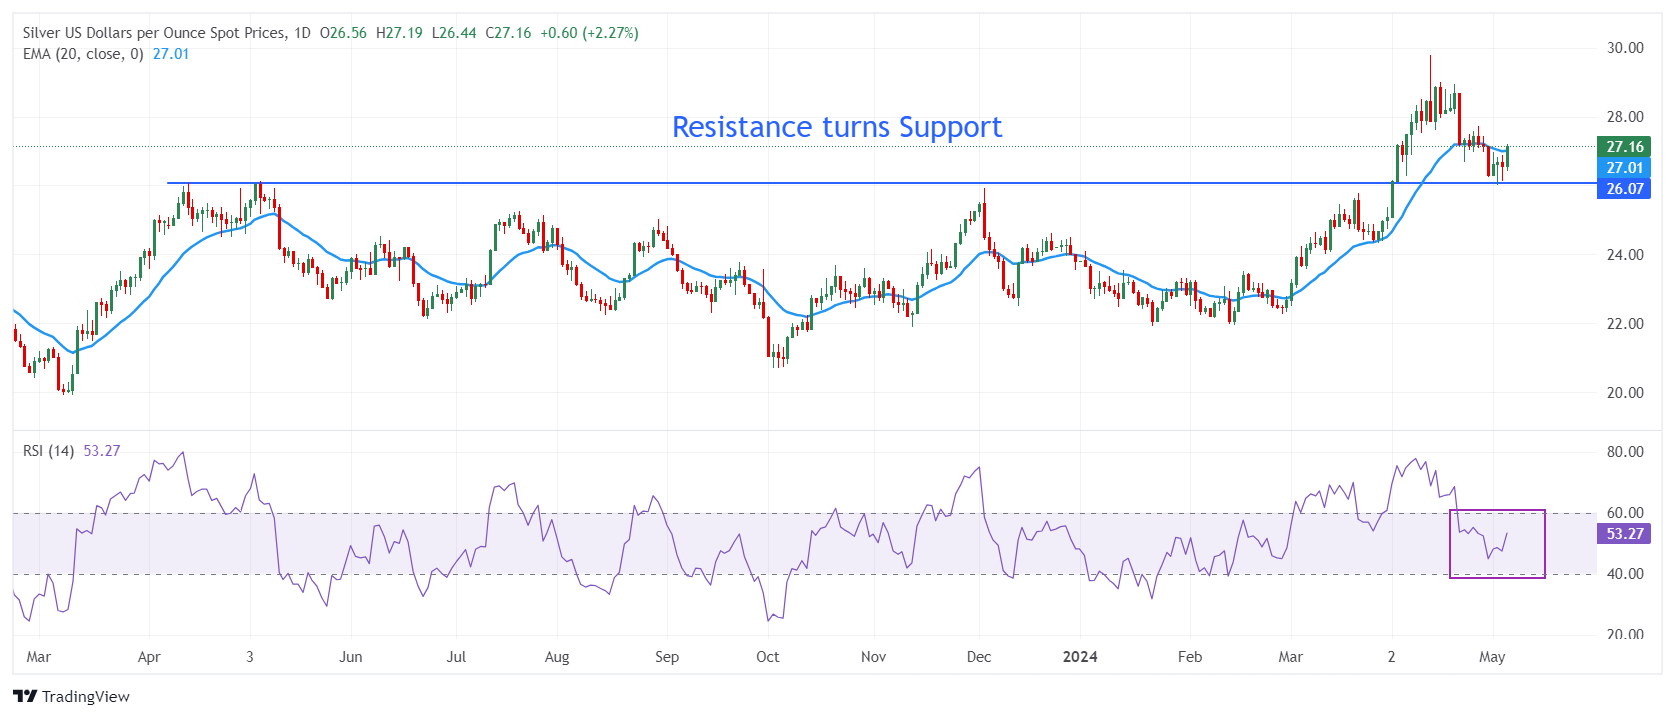
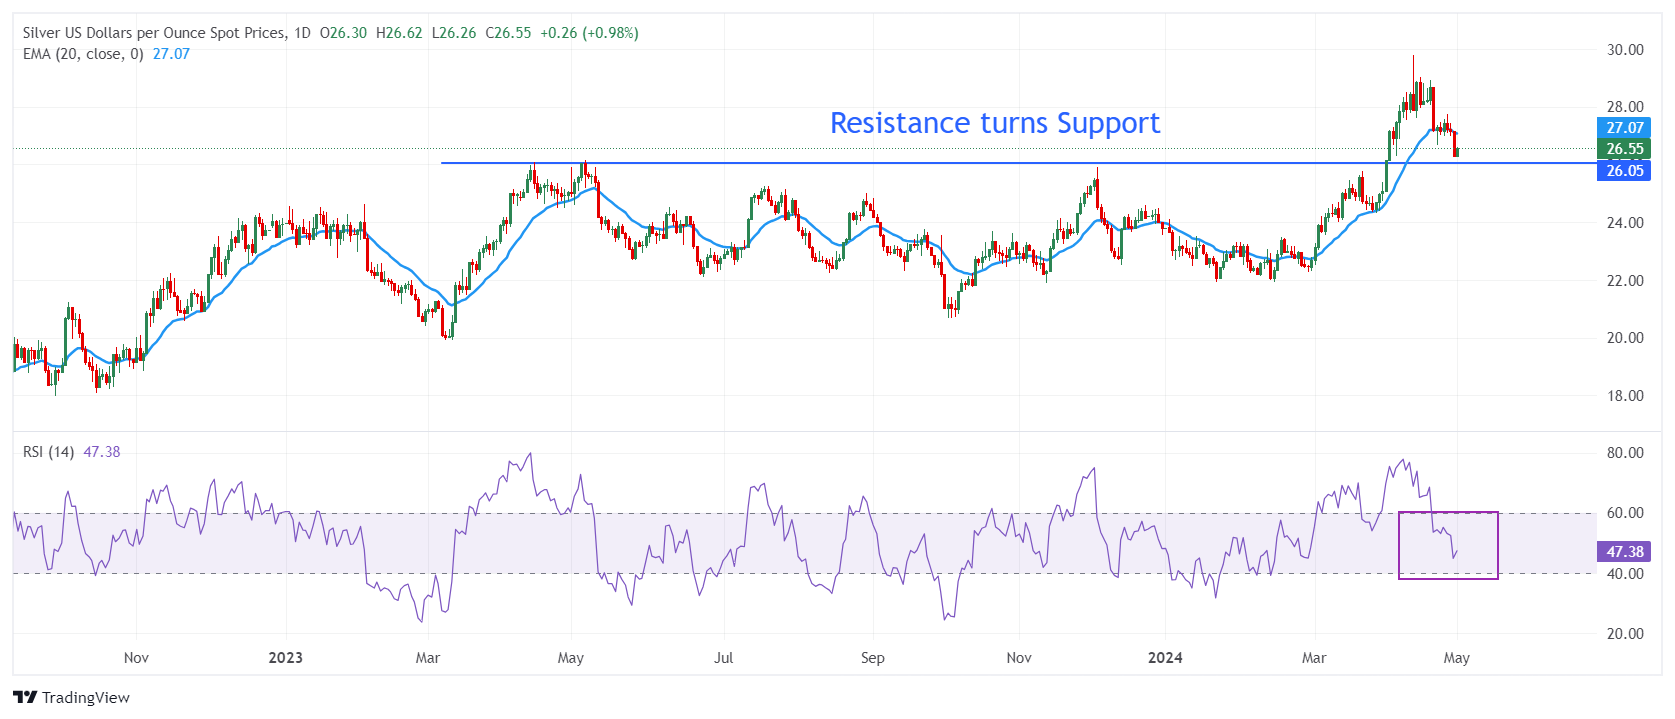
Silver price recovers sharply after discovering buying interest near the horizontal support plotted from 14 April 2023 high around $26.09 on a daily timeframe. The above-mentioned support was earlier a major resistance for the Silver price bulls. The white metal is approaching the multi-year high at $29.80.
The near-term outlook of Silver has improved as it returns above the 20-period Exponential Moving Average (EMA), which trades around $27.30.
The 14-period Relative Strength Index (RSI) shifts into the bullish range of 60.00-80.00, suggesting that a bullish momentum has been triggered.
Silver daily chart
-
14.05.2024 07:52Silver Price Forecast: XAG/USD rises to near $28.50 due to escalated geopolitical tensions
- Silver price appreciates due to escalated tensions in the Middle East on Tuesday.
- Israeli troops have advanced into the northern region of Gaza in an attempt to retake territory from Hamas militants.
- Fed officials indicated maintaining higher rates for longer, which may undermine the non-yielding assets like Silver.
Silver price extends its gains for the second consecutive session, trading around $28.30 per troy ounce during the early European session on Tuesday. The increase in the value of the safe-haven Silver can be attributed to the escalating geopolitical tensions in the Middle East. According to Reuters, Israeli forces have advanced significantly into the northern part of Gaza in an effort to reclaim territory from Hamas fighters.
The Silver price was bolstered after the weekly US Initial Jobless Claims released on Thursday, which surged to a near eight-month high at 231,000. This signaled a weakening labor market and potentially provided the Federal Reserve (Fed) with room to commence its easing cycle sooner rather than later.
However, Fed officials emphasized the importance of maintaining higher rates for longer given the elevated inflation. Fed Vice Chair Philip Jefferson reiterated this stance on Monday, advocating for keeping current interest rates until signs of inflation easing emerge. Higher interest rates typically dampen the attractiveness of non-yielding assets such as Silver.
Later in the day, traders will likely monitor the US Producer Price Index (PPI), a crucial economic indicator. The PPI report could have a significant impact on the US market. Traders might utilize the PPI data to gauge the potential outcome of the Consumer Price Index (CPI). If the PPI data surpasses expectations, it could reinforce the hawkish sentiment surrounding the Fed's commitment to maintaining higher rates for an extended period. This could potentially exert pressure on Silver prices.
-
13.05.2024 19:49Silver Price Analysis: XAG/USD gains marginally, clings above $28.00
- Silver prices climb due to a weaker US Dollar and lower US yields.
- Traders await key inflation data from the US and Fed Chair Powell's speech.
- Momentum favors bulls, but a daily close below $28.00 and Silver could dip toward $27.00, short-term.
Silver's price advanced 0.28% on Monday, courtesy of falling yields in US Treasuries and a softer US Dollar. A scarce economic schedule in the US keeps investors bracing for releasing the Consumer Price Index (CPI) on May 15, but first, traders will deal with Fed Chair Jerome Powell's speech on Tuesday. The XAG/USD trades at $28.22 after hitting a low of $27.97.
XAG/USD Price Analysis: Technical outlook
After peaking at around $28.74 last week, Silver dipped toward the $28.00 figure before reversing its course and shifting positively during the day. However, the grey metal remains below the June 10, 2021, high of $28.28, which could open the door for a pullback.
Momentum, as measured by the Relative Strength Index (RSI), favors the XAG/USD bulls, but a daily close below $28.00 could pave the way for further losses.
In that outcome, the XAG/USD first support would be the 38.2% Fib retracement at $27.70, followed by April’s 15 low of $27.59. Once cleared, the next stop would be the 50% Fib retracement at $27.06.
On the other hand, if Silver stays above $28.00, that could open the door for a bullish continuation. The first resistance would be May 10, high at $28.76. Once cleared, key resistance levels surface, like the $29.00 figure, followed by the year-to-date (YTD) high of $29.79.
XAG/USD Price Action – Daily Chart
-
10.05.2024 20:21Silver Price Analysis: XAG/USD retreats as shooting star looms, sellers eye $28.00
- Silver retreats from a three-week high reached at $28.74.
- Momentum favors bulls in the medium term; but shooting star looming paves the way for a retracement.
- Uptrend to resume with buyers clearing $28.74.
Silver prices reversed on Friday amid high US Treasury yields and a stronger US Dollar. The grey metal slipped 0.48% and exchanges hands at around $28.19, at the time of writing.
XAG/USD Price Analysis: Technical outlook
From a technical perspective, Silver is still upward biased, though the formation of a ‘shooting star,’ can pave the way for a pullback. Even though momentum favors bulls, as depicted by the Relative Strength Index (RSI) with readings between 60-70, its slope aims downwards.
Therefore, XAG/USD is bearishly biased in the short term. However, sellers will face solid support levels, like the $28.00 psychological level. Once cleared, the non-yielding metal could dive toward the 38.20% Fib retracement at $27.70, confluence with the April 62 high.
On the other hand, a bullish resumption could occur, if buyers reclaim the current week high of $28.76, followed by the $29.00 mark. A breach of the latter and buyers could challenge the year-to-date (YTD) high at $29.79.
XAG/USD Price Action – Daily Chart

-
10.05.2024 14:30Silver Price Forecast: XAG/USD clings to gains above $28 on Fed rate cut optimism
- Silver price holds gains above $28.00 amid firm speculation for Fed rate cuts.
- Steadily cooling US labor market conditions keep the US Dollar’s upside limited.
- Investors shift focus to the US Inflation data.
Silver price (XAG/USD) holds onto gains above the crucial figure of $28.00 in Friday’s New York session. The white metal remains firm as investors’ confidence in the Federal Reserve (Fed) starting to reduce interest rates from the September meeting has strengthened.
The CME FedWatch tool shows that traders see a 71% chance that interest rates will decline from their current levels in September, which are higher than 66% recorded a month ago. The speculation for the Fed pivoting to rate cuts has strengthened as investors lose conviction over United States labor market strength.
The US Department of Labor showed that individuals claiming jobless benefits for the first time at 231K for the week ending May 3 were higher in more than eight months. Also, recent official labor market data showed that job growth was the slowest in six months. The overall data suggests that the US labor market is struggling to bear the consequences of the Fed’s restrictive monetary policy framework.
The situation is favorable for non-yielding assets such as Silver but weighs on the US Dollar and bond yields. In spite of that the US Dollar Index (DXY), which tracks the Greenback’s value against six major currencies, holds above the 105.00 support. 10-year US Treasury yields jump to 4.49%.
Next week, US economic calendar will be data-packed as the Producer Price Index (PPI) and Consumer Price Index (CPI), and the Retail Sales data are lined-up for release. The major event will be the consumer price inflation data, which will influence market expectations for Fed rate cuts.
Silver technical analysis
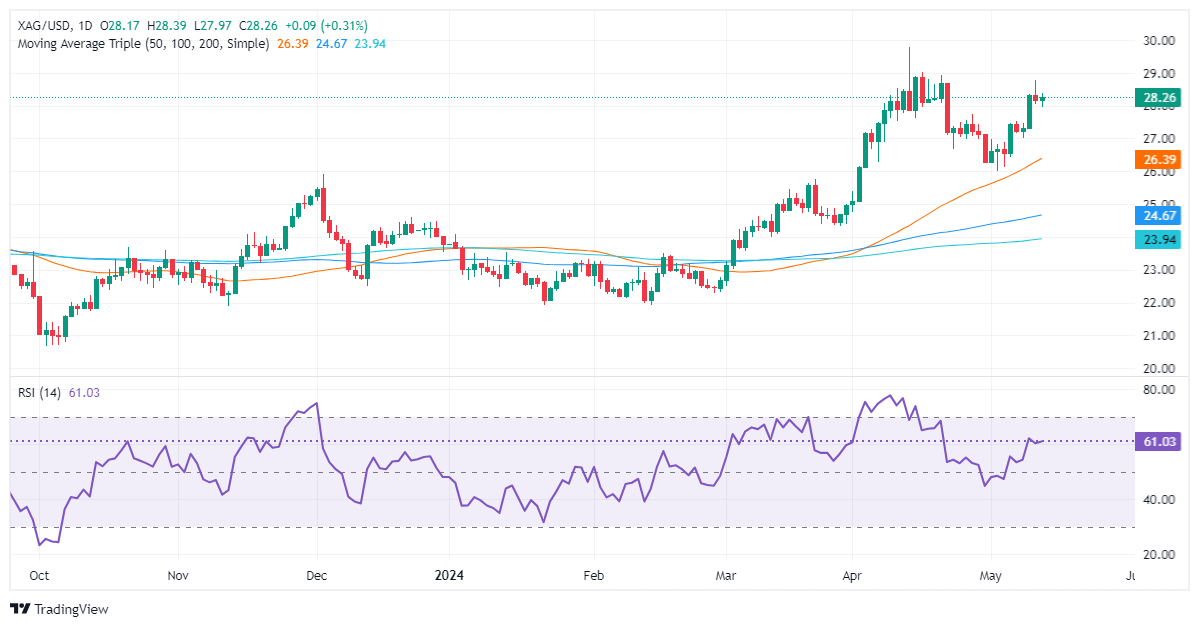
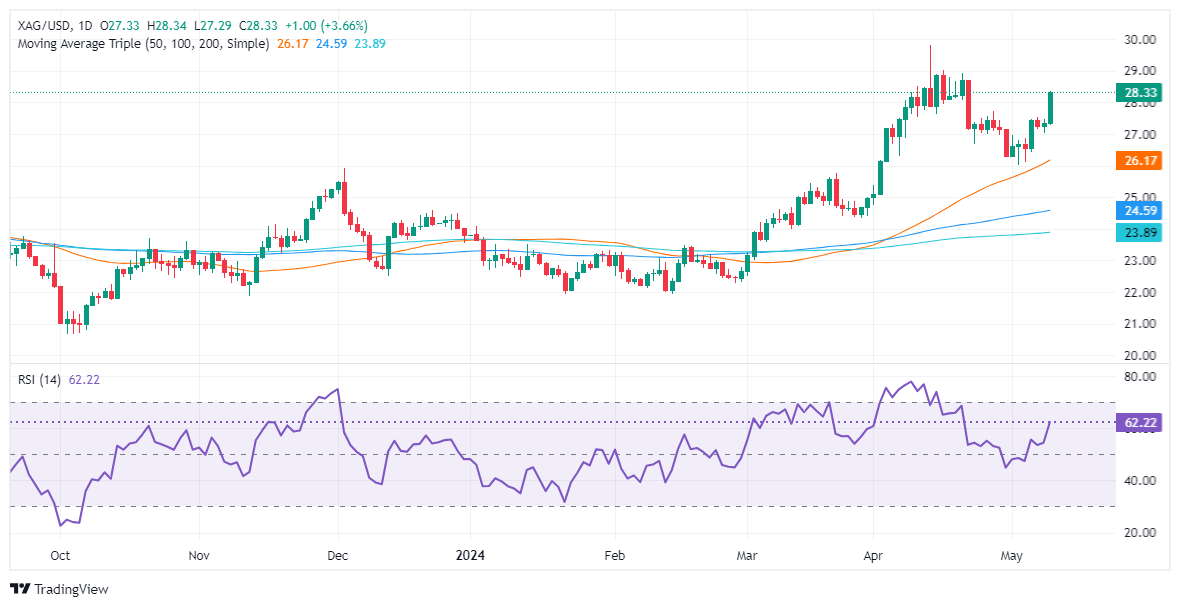
Silver price recovers sharply after discovering buying interest near the horizontal support plotted from 14 April 2023 high around $26.09 on a daily timeframe. The above-mentioned support was earlier a major resistance for the Silver price bulls. The near-term outlook of Silver has improved as it returns above the 20-period Exponential Moving Average (EMA), which trades around $27.30.
The 14-period Relative Strength Index (RSI) shifts into the bullish range of 60.00-80.00, suggesting that a bullish momentum has been triggered.
Silver daily chart
-
10.05.2024 06:06Silver Price Forecast: XAG/USD appreciates to near $28.50 after US Initial Jobless Claims
- Silver price edged higher after the weak labor data initiated the dovish sentiment surrounding the Fed.
- US Initial Jobless Claims surged to over 8-month highs to 231K, surpassing estimates of 210K.
- Silver cheers safe-haven demand amid a stalemate in ceasefire negotiations in the Middle East.
Silver price extends its gains for the third consecutive session, trading around $28.50 per troy ounce during the Asian session on Friday. The increase in the value of the grey metal can be attributed to the latest employment data from the United States (US), which supports a more accommodative monetary stance by the Federal Reserve (Fed).
Unexpectedly, US Initial Jobless Claims surged to over 8-month highs, signaling a weakening labor market and potentially providing the Fed with room to commence its easing cycle sooner rather than later. Lower interest rates typically enhance the attractiveness of non-yielding assets such as Silver.
The US Bureau of Labor Statistics (BLS) released data indicating that the number of individuals filing for unemployment benefits exceeded expectations. Initial Jobless Claims for the week ending May 3 rose to 231K, surpassing estimates of 210K and showing an increase from the previous week's reading of 209K. Furthermore, traders will closely monitor next week's CPI and PPI releases for further insights into the Fed's monetary stance, given reservations expressed by some Fed officials about easing.
On the geopolitical front, Silver experienced heightened safe-haven demand amidst a deadlock in ceasefire negotiations in the Middle East. Israeli forces mobilized tanks and engaged in gunfire near populated areas of Rafah on Thursday. This escalation followed President Joe Biden's statement that the US would withhold weapons from Israel if a substantial invasion of the southern Gaza city were initiated, as per Reuters report.
-
09.05.2024 21:07Silver Price Analysis: XAG/USD soars above key resistance as buyers’ eye $29.00
- Silver rallies, gaining nearly $1.00 to pass $28.00, fueled by falling US Treasury yields and a weaker dollar.
- Bullish technicals as RSI exceeds 60, indicating room for more upward movement.
- Resistance levels at $28.49 and $29.00, targeting year-to-date high of $29.79; support at $28.00 and $27.70.
Silver prices rallied sharply as US Treasury yields tumbled, and the Greenback weakened as major central banks opened the door to ease policy. At the time of writing, XAG-USD trades at $28.29, up by more than 3.50%.
XAG/USD Price Analysis: Technical outlook
After consolidating below the latest cycle high of $27.733 witnessed on April 26, the grey metal exploded with close to $1.00 gains, clearing the $28.00 threshold, with bulls eyeing the $28.50 mark.
As wrote on May 8, “The Relative Strength Index (RSI) is in bullish territory, indicating that momentum favors bulls,” This means, the precious metal could be headed for further gains, as the RSI just punched above the 60.00 threshold with enough room before turning overbought.
If buyers reclaim the 23.6% Fib retracement at $28.49, that could pave the way to test $29.00. Once cleared, the next stop would be the year-to-date (YTD) high of $29.79, followed by the $30.00 figure.
On the flip side, if sellers drag Silver below $28.00, the immediate support would be the 38.2% Fib retracement at $27.70, followed by the 50% Fib retracement at $27.05. Once those levels are cleared, up next is the psychological $27.00 figure.
XAG/USD Price Action – Daily Chart
-
08.05.2024 20:40Silver Price Analysis: XAG/USD recovers after testing $27.00 psychological level
- Silver rebounds from $27.00, rising 0.38% amid increased buying interest.
- Remains bullish, trading between Fibonacci levels of $24.33 and $29.78.
- To gain further, needs to surpass 38.2% Fibonacci level at $27.70, targeting $28.00 and beyond.
Silver price registers modest gains despite rising US Treasury bond yields and a strong US Dollar. The grey metal dipped to $27.00 but climbed as buyers stepped in. The XAG/USD trades at $27.33, up by 0.38%.
XAG/USD Price Analysis: Technical outlook
Silver remains upward biased, and it remains trading within the 50% and 38.2% Fibonacci retracements, drawn from the latest cycle low and high, each at $24.33 and $29.78, respectively.
The Relative Strength Index (RSI) is in bullish territory, indicating that momentum favors bulls. However, from a price action standpoint, buyers need to clear the 38.2% Fib retracement at $27.70 to challenge year-to-date (YTD) highs. Once surpassed, the next key resistance level would be the $28.00 psychological figure, followed by the 23.6% Fib retracement at $28.49 ahead of $29.00.
On the flip side, if sellers want to push prices lower, they must drag prices below the 50% Fib retracement at $27.05. Once done, sellers must clear $27.00, followed by the confluence of the May 2 low and the 50-day moving average (DMA) at $26.02/08.
XAG/USD Price Action – Daily Chart
-
07.05.2024 22:23Silver Price Analysis: XAG/USD retreats amid strong US Dollar
- Silver drops in late trading, impacted by a strong US Dollar and falling Treasury yields.
- Remains technically bullish, trading within key Fibonacci levels from $24.33 to $29.78.
- Resistance at $27.70, support at $27.05; market trends could push price to $28.00 or below $27.00.
Silver price slid late in the North American session due to overall US Dollar strength across the board amid falling US Treasury yields. Despite that, the XAG/USD trades at $27.23, down 0.71%.
XAG/USD Price Analysis: Technical outlook
The grey metal remains upward-biased despite retreating toward the $27.20 area on Tuesday. It should be said that XAG/USD is still trading within the 50% and 38.2% Fibonacci retracements, drawn from the latest cycle low and high, each at $24.33 and $29.78, respectively.
If Silver buyers would like to regain control, they must clear the 38.2% Fibo retracement at $27.70. Once surpassed, emerge key resistance levels, like the $28.00 psychological figure, followed by the 23.6% Fibo retracement at $28.49 ahead of $29.00.
On the flip side, if sellers want to push prices lower, they must drag prices below the 50% Fibo retracement at $27.05. Once done, sellers must clear $27.00, followed by the confluence of the May 2 low and the 50-day moving average (DMA) at $26.02/08.
XAG/USD Price Action – Daily Chart
-
07.05.2024 12:58Silver Price Forecast: XAG/USD holds gains above $27 on Fed rate-cut optimism
- Silver price exhibits gains above $27.00 due to deepening optimism over Fed reducing rates in September.
- Weak US labor market boosts expectations of Fed rate cuts.
- Lower bond yields improve demand for Silver.
Silver price (XAG/USD) falls slightly from weekly high of $27.50 but manages a firm-footing above the crucial support of $27.00 in Tuesday’s late European session. The white metal holds strength as investors remain optimist about the Federal Reserve (Fed) reducing interest rates in the September meeting.
The speculation for the Fed lowering interest rates from September have strengthened as recent United States economic data for April has indicated that the economy is struggling to cope with the restrictive interest rate framework by the Fed.
The US Nonfarm Payrolls (NFP) report released on Friday indicated fewer job additions, higher Unemployment Rate and slower wage growth. Signs of easing labor market conditions build confidence of the Fed pivoting to interest rate cuts from September. Cooling labor market conditions suggest a soft inflation outlook.
10-year US Treasury yields fall to 4.46%. A decline in yields on interest-bearing assets reduces the opportunity cost of holding investment in non-yielding assets, such as Silver. The US Dollar Index (DXY), which tracks the Greenback’s value against six major currencies, trades above 105.00.
Meanwhile, deepening risks of Israel extending operation to Rafah, the southern part of Gaza, have improved the appeal of bullions. The Israel assault at Gaza is expected to worsen further as it has denied ceasefire proposal, which was agreed by Hamas, stating that it doesn’t meet their demands. Risks of geopolitical uncertainty are favorable for safe-haven assets such as Silver.
Silver technical analysis
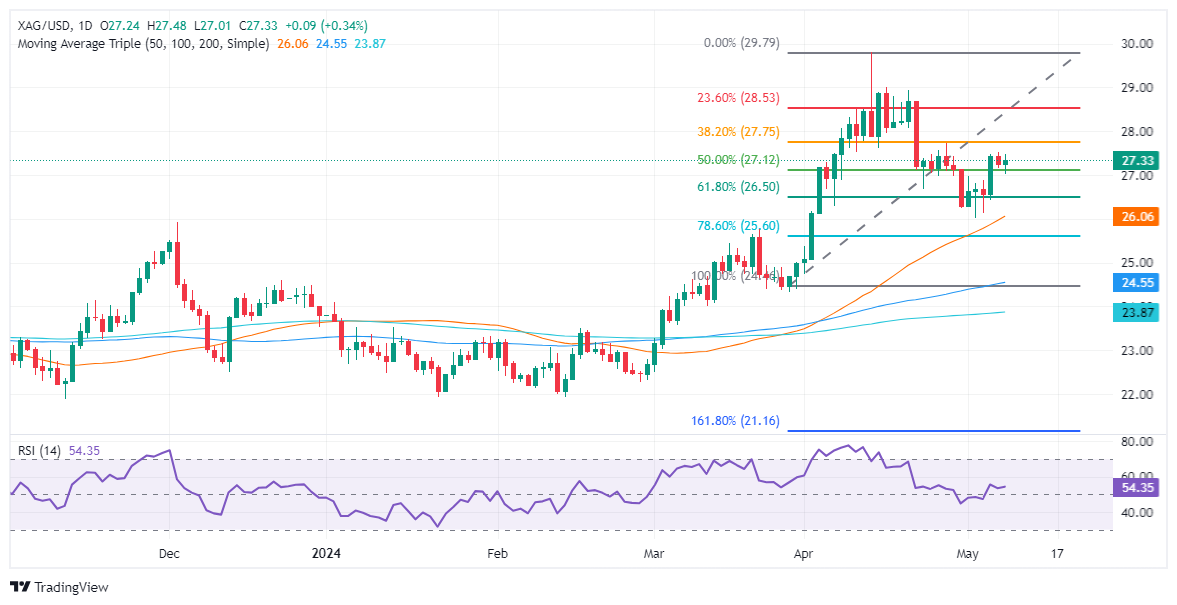
Silver price recovers after testing strength of the prior horizontal support plotted from 14 April 2023 high around $26.09 on a daily timeframe. The above-mentioned support was earlier a major resistance for the Silver price bulls. The uncertainty over Silver’s near-term outlook still remains as it has yet not settled above the 20-period Exponential Moving Average (EMA), which trades around $27.20.
The 14-period Relative Strength Index (RSI) slips into the 40.00-60.00, suggesting that the bullish momentum has faded. However, the long-term outlook is still stable.
Silver daily chart
-
06.05.2024 10:29Silver Price Forecast: XAG/USD extends recovery to $27 as weak US data reinforces Fed rate cut bets
- Silver price moves higher to $27.20 as weak US data falters US economic strength.
- Traders have priced in the Fed reducing interest rates from September.
- Lower bond yields improve the Silver’s appeal.
Silver price (XAG/USD) stretches recovery to $27.20 in Monday’s European session. The white metal capitalizes on weak United States labor market and Services PMI that raises concerns over the economic strength and prompt expectations for Federal Reserve (Fed) cutting interest rates from the September meeting.
The US Nonfarm Payrolls (NFP) report showed that fewer jobs were added in April than the consensus and the prior reading. The Unemployment Rate rose to 3.9%. Also, wage growth softened sharply. Poor US NFP report indicated deepening consequences of higher interest rates by the Fed. Also, weak Services PMI strengthened expectations for Fed rate cuts in September.
The Services PMI, which represents the service sector that accounts for two-thirds of the economy falls below the 50.0 threshold to 49.4, recorded as the lowest reading since December 2022.
Despite broader data was weak, traders were reluctant to bring forward expectations for Fed rate cuts as the ISM Price Paid subindex rose sharply to 59.4 from 53.4 in March. This is a leading indicator of the US inflation outlook as it exhibits prices paid for inputs businesses.
Weak US data has weighed on the US Dollar Index (DXY) as it struggles for a firm-footing above 105.00. 10-year US Treasury yields fell sharply to 4.47%. A decline in yields on interest-bearing assets uplift demand for non-yielding assets, such as Silver, as the opportunity cost of holding an investment in them diminishes.
Silver technical analysis
Silver price recovers after discovering strong buying interest near the horizontal support plotted from 14 April 2023 high around $26.09 on a daily timeframe. The above-mentioned support was earlier a major resistance for the Silver price bulls. The uncertainty over Silver’s near-term outlook still remains as it has yet not settled above the 20-period Exponential Moving Average (EMA), which trades around $27.20.
The 14-period Relative Strength Index (RSI) slips into the 40.00-60.00, suggesting that the bullish momentum has faded. However, the long-term outlook is still stable.
Silver daily chart
-
03.05.2024 20:41Silver Price Analysis: XAG/USD test key resistance levels amid uptrends
- Silver dips to $26.54, down 0.43%; 'dragonfly doji' hints at possible uptrend.
- Finds support at 61.8% Fibonacci level ($26.41); crossing $27.00 could boost bullish momentum.
- Downside risk if below May 2 low of $26.02, aiming for 50-day MA at $25.79.
Silver price uptrend continued during the week despite registering losses of around 2.40%. Nevertheless, May 2’s price action forming a ‘dragonfly doji,’ a bullish candle, alongside technical indicators suggesting that the grey metal remains bullish, could pave the way for a recovery. At the time of writing, XAG/USD trades at $26.54, down 0.43%.
XAG/USD Price Analysis: Technical outlook
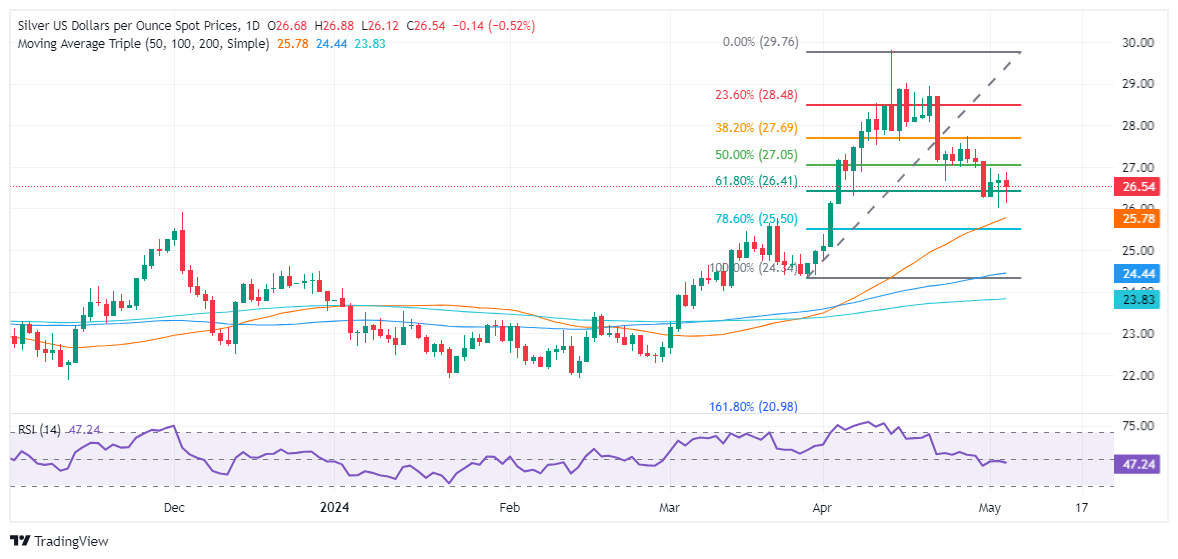
As previously mentioned, Silver remains bullishly biased after posting an impressive rally that passed the $29.00 mark. It appears to have bottomed out at around the 61.8% Fibonacci retracement at $26.41, though buyers had been unable to test the $27.00 mark.
Although momentum had shifted bearishly, with the Relative Strength Index (RSI) diving below the 50-midline, upside risks remain. If buyers reclaim the $27.00 figure, that could reignite buying pressure and pave the way to challenge the next resistance level seen at the 38.2% Fibo retracement at $27.70. Once surpassed, the next step would be the 23.6% Fibo retracement at $28.49.
Nevertheless, with the RSI standing at bearish territory, sellers need to push prices below the May 2 low of $26.02. Once cleared the next stop would be the 50-day moving average (DMA) at $25.79, followed by the 78.6% Fibo retracement at $25.50.
XAU/USD Price Action – Daily Chart
-
03.05.2024 14:01Silver Price Forecast: XAG/USD plummets to $26 despite weak US NFP data
- Silver price plunges to $26 despite a sell-off in the US Dollar and bond yields.
- The US NFP report for April exhibited weak labor demand and soft wage growth.
- Weak labor demand will boost Fed rate cut prospects for September.
Silver price (XAG/USD) reverses gains and falls sharply to $26.00 despite the United States Nonfarm Payrolls (NFP) data for April turned out weaker than expected. The US NFP report showed that employers hired 175K job-seekers, weaker than the consensus of 243K and the prior reading of 315K, upwardly revised from 303K. The Unemployment Rate rises to 3.9% while investors forecasted it to remain steady at 3.8%.
The Average Hourly Earnings, which feeds the consumer spending and eventually reflects the inflation outlook, softened to 3.9%. Investors forecasted the wage growth to decelerate to 4.0% from March’s reading of 4.1%. Monthly wage growth data grew at a slower pace of 0.2%, against the estimates and the prior reading of 0.3%.
Weak labor demand and soft wage growth would force the Federal Reserve (Fed) to unwind its restrictive policy framework earlier, which it has been maintaining for almost two years. Currently, investors expect that the Fed will start reducing interest rates from the September meeting. The situation is unfavorable for the US Dollar and Treasury yields. The US Dollar Index (DXY), which tracks the Greenback’s value against six major currencies, prints a fresh three-week low around 104.50. 10-year US Treasury Yields weaken to 4.49%.
Generally, lower yields on interest-bearing assets weigh on non-yielding assets such as Silver as they reduce the opportunity cost of holding investment in them. Therefore, the Silver price could reverse losses ahead.
Silver technical analysis
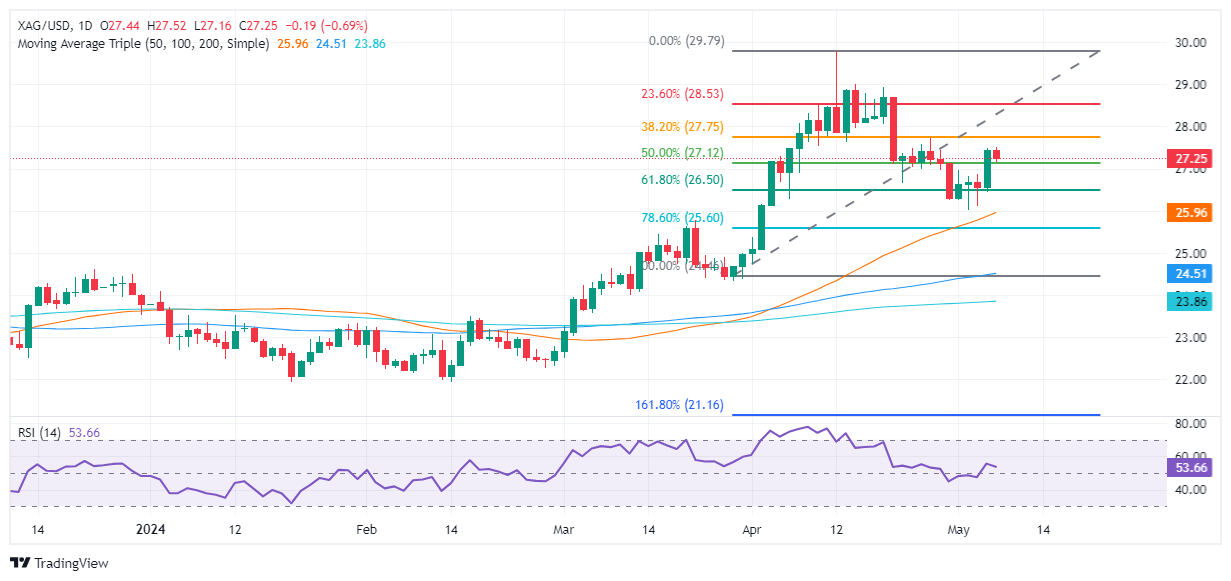
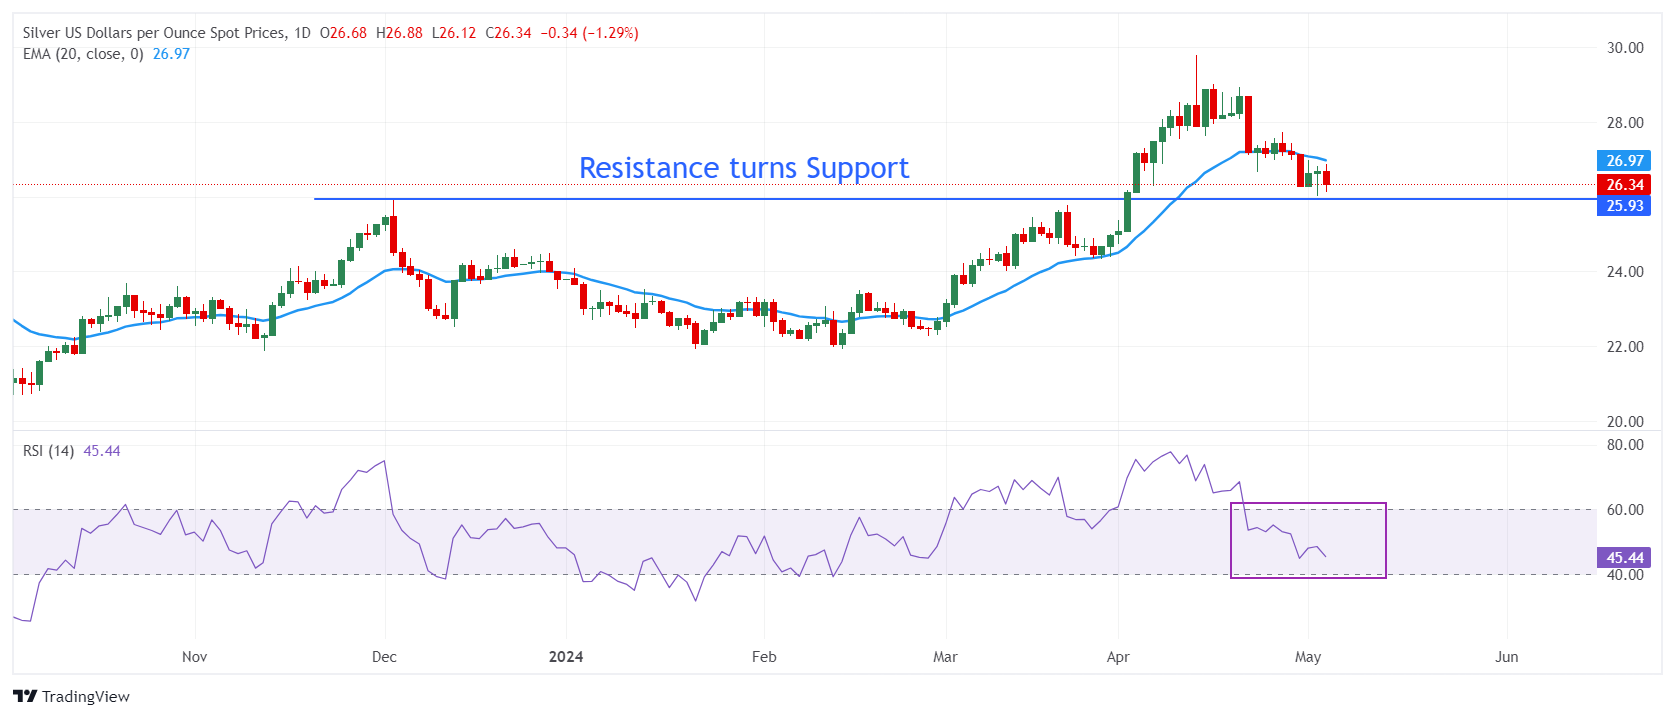
Silver price declines to near the horizontal support plotted from 14 April 2023 high around $26.09 on a daily timeframe. The above-mentioned support was earlier a major resistance for the Silver price bulls. The uncertainty over Silver’s near-term outlook deepens as it has slipped below the 20-period Exponential Moving Average (EMA), which trades around $27.20.
The 14-period Relative Strength Index (RSI) slips into the 40.00-60.00, suggesting that the bullish momentum has faded. However, the long-term outlook is still stable.
Silver daily chart
-
03.05.2024 08:51Silver Price Forecast: XAG/USD depreciates to near $26.50 ahead of US NFP
- Silver price faced challenges as traders adopt caution ahead of US Nonfarm Payrolls due on Friday.
- A softer US NFP report could support the Fed's adopting a less hawkish stance on its rate trajectory.
- Egypt has taken the lead in revitalizing stalled peace between Israel and Hamas, undermining the safe-haven Silver.
Silver price snaps its two-day winning streak, trading around $26.50 per troy ounce during the European session on Friday. The prices of the white metal faced challenges as traders exercised caution ahead of the Nonfarm Payrolls (NFP) data from the United States (US) due later in the day. The US NFP report is expected to print a reading of 243K for April, compared to 303K prior, which could offer support for the Federal Reserve’s (Fed) stance to be less hawkish on interest rate policy.
On Thursday, the report of the US Initial Jobless Claims indicated that the number of Americans filing new claims for unemployment benefits for the week ending April 26, showed no change from the previous week. It remained at 208K, the lowest level in two months and significantly below market expectations of 212K. This could give the Federal Reserve flexibility to delay interest rate cuts. The higher interest rates for a longer period could dampen the demand for non-yielding assets like Silver.
The US Federal Reserve kept interest rates unchanged at 5.25-5.50% on Wednesday, signaling a continued inclination toward future rate cuts. The downside for the Silver price remains limited in the wake of the prevalent US Dollar (USD) selling bias, led by Fed Chair Jerome Powell's less hawkish remarks. Powell dismissed any further interest rate hike during the FOMC conference after the policy decision. This, in turn, acted as a tailwind for the Silver price.
In the Middle East, the decreasing geopolitical tensions are weighing on safe-haven Silver, fueled by hopes for a ceasefire deal between Israel and Hamas. Egypt has taken the lead in revitalizing stalled peace talks this week, supported by US Secretary of State Antony Blinken's call for Hamas to accept Israel's ceasefire proposal in exchange for the release of hostages.
-
02.05.2024 10:19Silver Price Forecast: XAG/USD retreats from $26.80 amid uncertainty ahead of US NFP
- Silver price drops from $26.80 as US Dollar, bond yields rebound ahead of US Employment data.
- The US Employment data will influence speculation for Fed rate cuts in June.
- The Fed is still confident of rate cuts this year despite progress in disinflation has stalled.
Silver price (XAG/USD) falls back sharply to $26.20 while attempting to recapture the crucial resistance of $27.00 during the European session on Thursday. The white metal faces pressure as the US Dollar and bond yields attempt to recover amid uncertainty ahead of the United States Nonfarm Payrolls (NFP) and the ISM Services PMI data for April, which will be published on Friday.
The US NFP data would significantly influence market expectations for Federal Reserve (Fed) rate cuts from the June meeting. Economists have anticipated that US employers recruited 243K jobs, lower than 303K additions registered in March. The Unemployment Rate is forecasted to have remained steady at 3.8%.
Investors will keenly focus on the US Average Hourly Earnings data. The annual Average Hourly Earnings are expected to have grown at a slower pace of 4.0% from 4.1% in March, with steady 0.3% growth on a month-on-month basis. Average Hourly Earnings are a leading indicator of wage growth, which indicates the current status of households’ spending and eventually influences price pressures.
The US Dollar Index (DXY) rebounds to 105.75 and 10-year US Treasury yields edge up to 4.61. The US Dollar and bond yields tumbled on Wednesday after less hawkish interest rate guidance from the Federal Reserve (Fed) than feared. The Fed remains optimistic over eventual rate cuts this year despite risks of a slowdown in the disinflation process.
Silver technical analysis
Silver price declines to near the horizontal support plotted from 14 April 2023 high around $26.09 on a daily timeframe. The above-mentioned support was earlier a major resistance for the Silver price bulls. The uncertainty over Silver’s near-term outlook deepens as it has slipped below the 20-period Exponential Moving Average (EMA), which trades around $27.20.
The 14-period Relative Strength Index (RSI) slips into the 40.00-60.00 range, suggesting that the bullish momentum has faded. However, the long-term outlook is still stable.
Silver daily chart
-
01.05.2024 14:24Silver Price Forecast: XAG/USD bounces back to $26.60 after weak US Manufacturing PMI report
- Silver price rebounds sharply from $26.30 as US Manufacturing PMI contracted in April.
- The speculation for Fed’s hawkish interest rate outlook remains firm as Manufacturing Price Paid rise above 60.0.
- Investors await the Fed’s policy decision for meaningful guidance.
Silver price (XAG/USD) recovers strongly from four-month low of $26.30 as the United States Institute of Supply Management (ISM) has reported a weak Manufacturing PMI report for April. The ISM reported that the Manufacturing PMI falls sharply to 49.2 from the consensus of 50.0 and the prior reading of 50.3. The factory data remained below the 50.0 threshold, which itself is a sign of contraction.
New Order Inflows drop significantly to 49.1 from 51.4 in March, suggesting a weak demand outlook, which could be considered as the consequence of higher interest rates by the Federal Reserve (Fed).
Despite a sharp decline in the Manufacturing PMI, the Fed is expected to support the “higher for longer interest rates” argument as Manufacturing Price Paid rose significantly to 60.9 from the estimates of 55.0. Higher Manufacturing Prices Paid are generally driven by an increase in input prices and wages paid to workers, which suggests stubborn price pressures.
Weak Manufacturing PMI has weighed on the US Dollar. The US Dollar Index (DXY) edges down from fresh three-week high of 106.50.
Meanwhile, the major event for investors will be the interest rate decision by the Federal Reserve, which will be announced at 18:00 GMT. Investors see the Fed holding interest rates steady in the range of 5.25%-5.50% for the sixth time in a row. As the Fed is widely anticipated to maintain the status quo, investors will keenly focus on the interest rate guidance.
The CME FedWatch tool shows that policymakers will favor unwinding the restrictive monetary policy framework from the September meeting. Therefore, the Fed will maintain a hawkish stance on interest rates in the near-term. Investors would keenly focus on whether the Fed will remain committed to its three-rate cut projections for this year, indicated by Marchs dot plot.
Silver technical analysis
Silver price declines toward the horizontal support plotted from 14 April 2023 high around $26.09 on a daily timeframe. The above-mentioned support was earlier a major resistance for the Silver price bulls. The uncertainty over Silver’s near-term outlook deepens as it has slipped below the 20-period Exponential Moving Average (EMA), which trades around $27.20.
The 14-period Relative Strength Index (RSI) slips into the 40.00-60.00, suggesting the bullish momentum has faded. However, the long-term outlook is still stable.
Silver daily chart
-
01.05.2024 05:50Silver Price Forecast: XAG/USD rebounds to near $26.50 despite hawkish Fed
- Silver price edges higher despite the hawkish sentiment surrounding the Fed.
- The prolonged higher interest rates could dampen the demand for non-yielding assets like silver.
- The stronger Employment Cost Index bolstered the strength of the US Dollar.
Silver price recovers its recent losses registered in the previous session, trading around $26.50 per troy ounce during the Asian trading hours on Wednesday. However, US Dollar (USD) strengthened on the back of rising US Treasury yields. Market participants adopt a cautious stance ahead of the Federal Reserve's (Fed) policy decision.
The stronger labor cost data from the United States (US) has reignited discussions about the Federal Reserve potentially delaying rate cuts due to inflationary pressures. The US Employment Cost Index surged by 1.2% in the first quarter, marking its largest increase in a year and surpassing both expectations of 1.0% and the previous figure of 0.9%. This data underscores existing wage pressures, which could exacerbate the impact of persistent inflation within the US economy.
Traders have been scaling back expectations for Fed rate cuts this year, buoyed by robust US economic data and persistent inflation. According to the CME FedWatch Tool, the probability of the Federal Reserve maintaining interest rates at their current level of 5.5% in June has surged to 91.6%, up from 81.2% a week ago. The prospect of higher interest rates increases the opportunity cost of holding non-yielding assets like Silver, dampening its appeal.
Investors are expected to monitor the release of the ADP Employment Change and ISM Manufacturing PMI from the United States on Wednesday, ahead of the Fed's Monetary Policy Statement. These data releases are likely to provide further insights into the current state of the US economy, influencing market expectations regarding future monetary policy decisions.


© 2000-2024. All rights reserved.
This site is managed by Teletrade D.J. LLC 2351 LLC 2022 (Euro House, Richmond Hill Road, Kingstown, VC0100, St. Vincent and the Grenadines).
The information on this website is for informational purposes only and does not constitute any investment advice.
The company does not serve or provide services to customers who are residents of the US, Canada, Iran, The Democratic People's Republic of Korea, Yemen and FATF blacklisted countries.
Making transactions on financial markets with marginal financial instruments opens up wide possibilities and allows investors who are willing to take risks to earn high profits, carrying a potentially high risk of losses at the same time. Therefore you should responsibly approach the issue of choosing the appropriate investment strategy, taking the available resources into account, before starting trading.
Use of the information: full or partial use of materials from this website must always be referenced to TeleTrade as the source of information. Use of the materials on the Internet must be accompanied by a hyperlink to teletrade.org. Automatic import of materials and information from this website is prohibited.
Please contact our PR department if you have any questions or need assistance at pr@teletrade.global.
transfers