- Analytics
- News and Tools
- Quotes
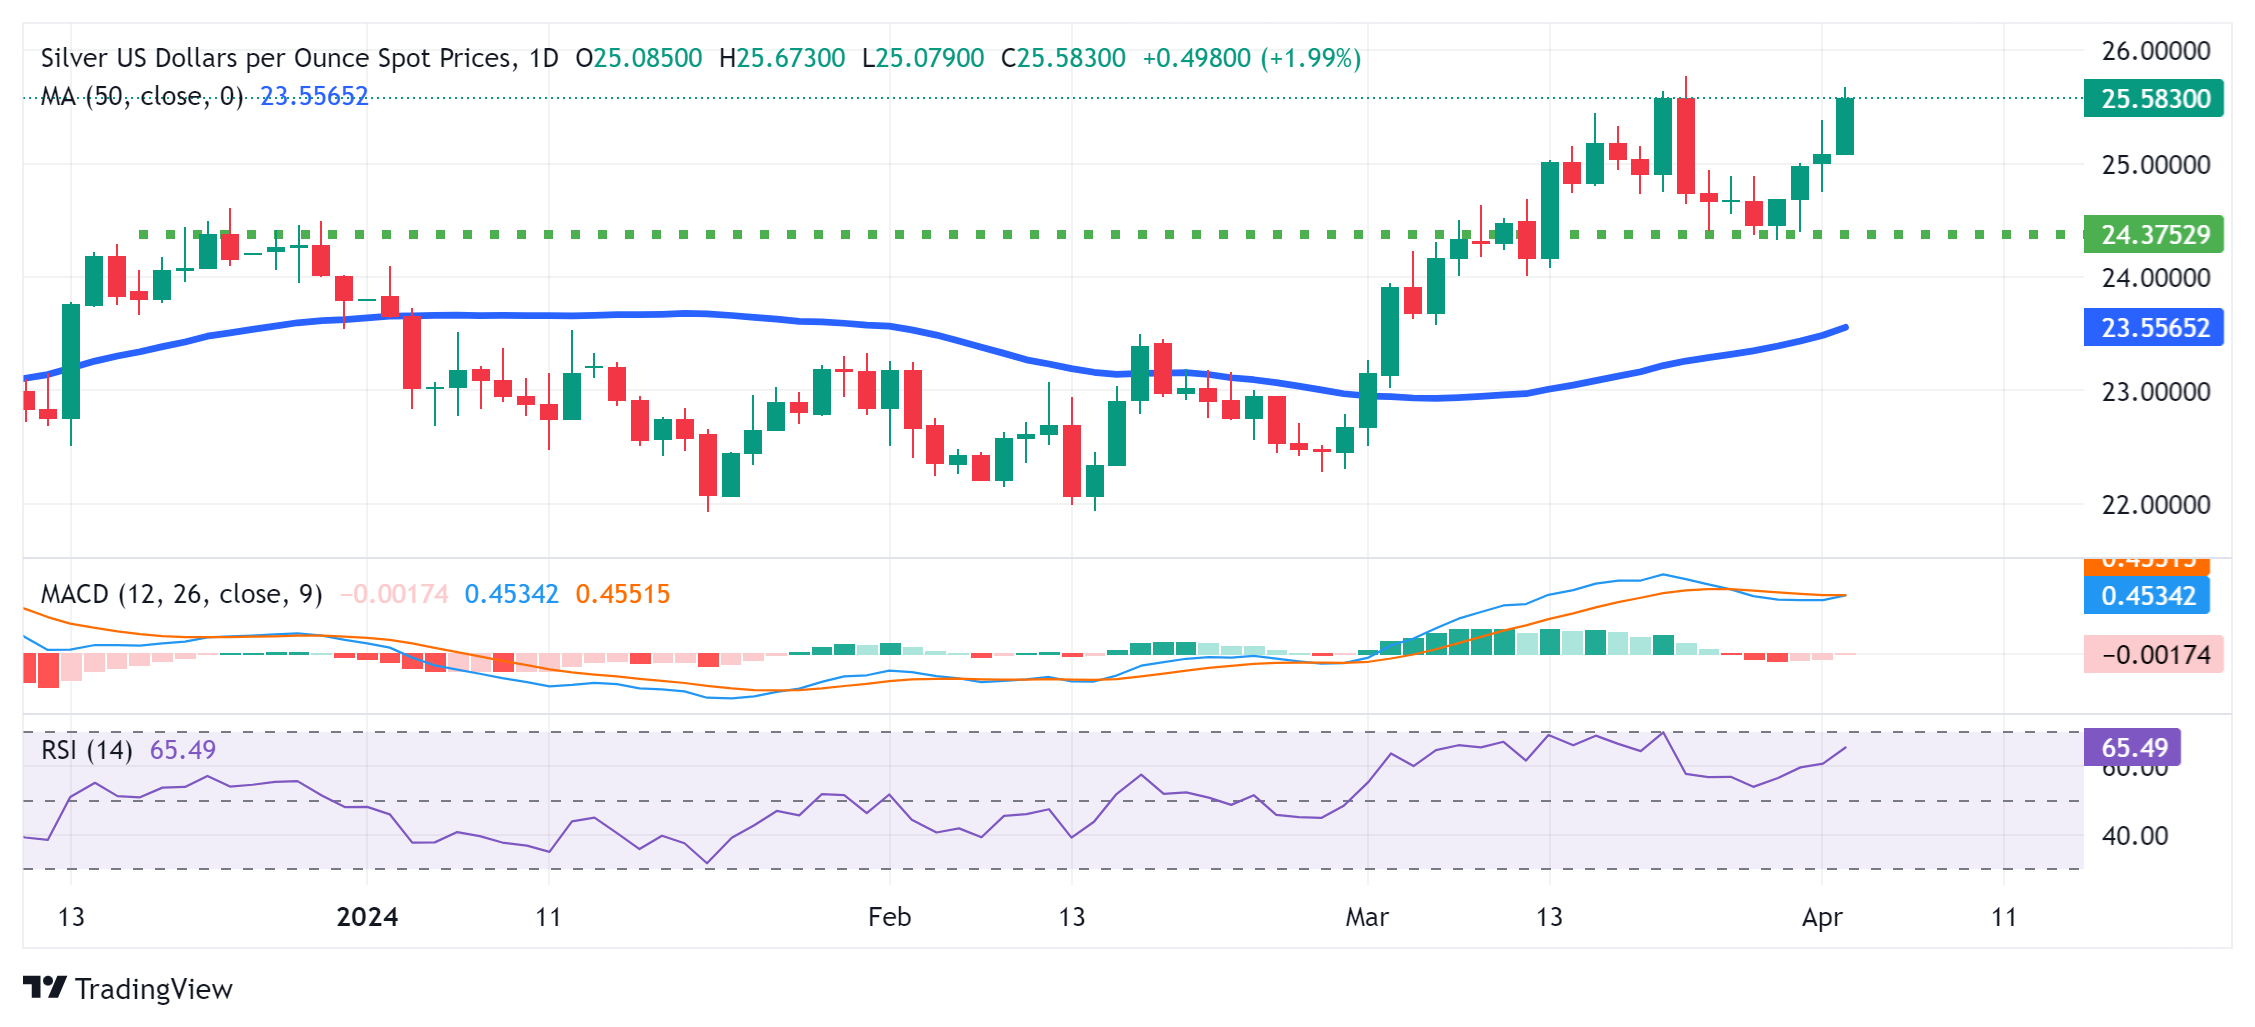
- Chart and quotes for XAGUSD
Quotes and rates for precious metals Silver vs US Dollar (XAGUSD)
| Date | Rate | Change |
|---|
Related news
-
15.04.2024 22:27Silver Price Analysis: XAG/USD remains bullish, eyeing $29.00
- XAG/USD climbs 3.61%, nearing $29.00 due to robust demand in the precious metals sector.
- Technical analysis suggests further upside potential, with aims at the April 12 high of $29.79 and the key $30.00 level.
- Key supports are at the May 18, 2021, high of $28.75, the June 10, 2021, high of $28.28, and the crucial $28.00 psychological level.
Silver's price rose past $28.00, extending its gains close to the $29.00 threshold, which was briefly pierced last Friday, but buyers failed to hold the price above that level. At the time of writing, XAG/USD trades at $28.85, up by 3.61%.
XAG/USD Price Analysis: Technical outlook
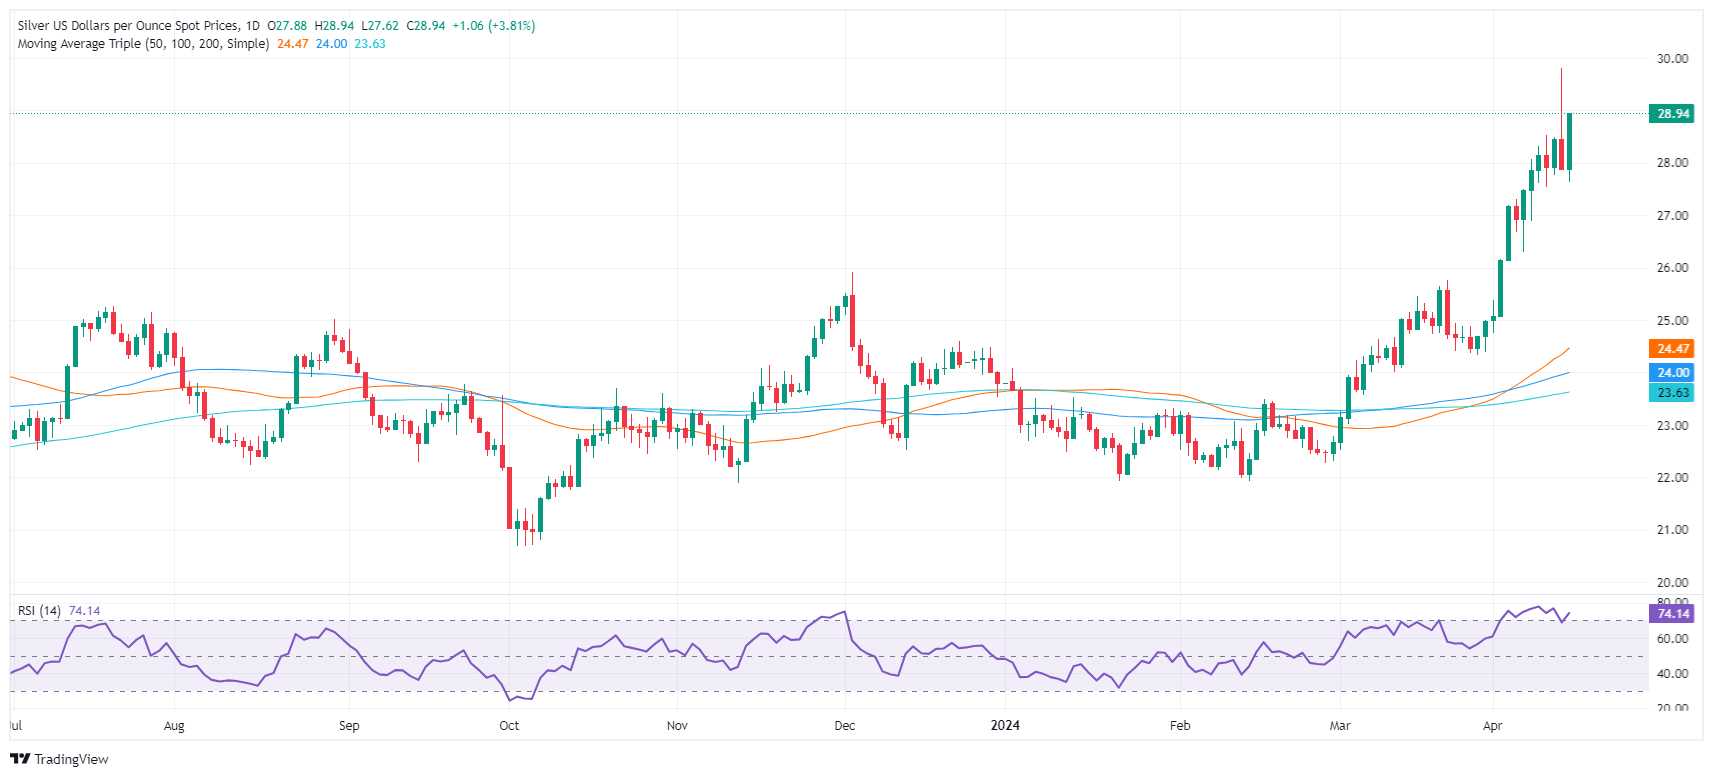
Silver’s daily chart portrays the grey metal is bullish, shy of reclaiming the $29.00 handle. Once cleared, the next resistance would be the April 12 high of $29.79 before aiming toward the $30.00 threshold, last seen in February 2013. The next resistance would be February’s monthly high at $32.15.
Conversely, XAG/USD’s first support would be the May 18, 2021, high turned support at $28.75, followed by the June 10, 2021, high at $28.28. Once those two levels are surpassed, the $28.00 psychological level will be next.
XAG/USD Price Action – Daily Chart
-
15.04.2024 14:20Silver Price Forecast: XAG/USD recovers above $28.50 despite multiple tailwinds
- Silver price bounces back to $28.50 even though investors expect Middle East tensions won’t escalate further.
- US bond yields rally amid uncertainty over Fed rate cut timing.
- Upbeat US Retail Sales boost demand for the US Dollar.
Silver price (XAG/USD) finds strong buying interest near $27.50 after correcting from fresh highs of $29.80. The white metal rebounds to $28.50 in Monday’s American session but struggles to extend recovery as investors expect that Middle East tensions will not escalate further.
Iran said we don’t want to raise tensions in the Middle East further. Their administration added, “the matter deemed to be closed.” However, should the Israeli regime make another mistake, Iran’s response will be considerably more severe, the Wall Street Journal reported. Meanwhile, US President Joe Biden said it won’t support the counterattack from Israel. On Saturday, Iran launched hundreds of drones and missile on the Israeli state.
Meanwhile, higher bond yields due to deepening uncertainty about when the Federal Reserve (Fed) will pivot to rate cuts is barricading the Silver price from further upside. 10-year US Treasury yields rise to 4.65%.
The US Dollar Index (DXY) extends its upside to 106.20 after upbeat US Retail Sales data for March. The US Census Bureau reported that Retail Sales rose strongly by 0.7% from expectations of 0.3% but the pace was slower than the prior reading of 0.9%, upwardly revised from 0.6%.
Silver technical analysis
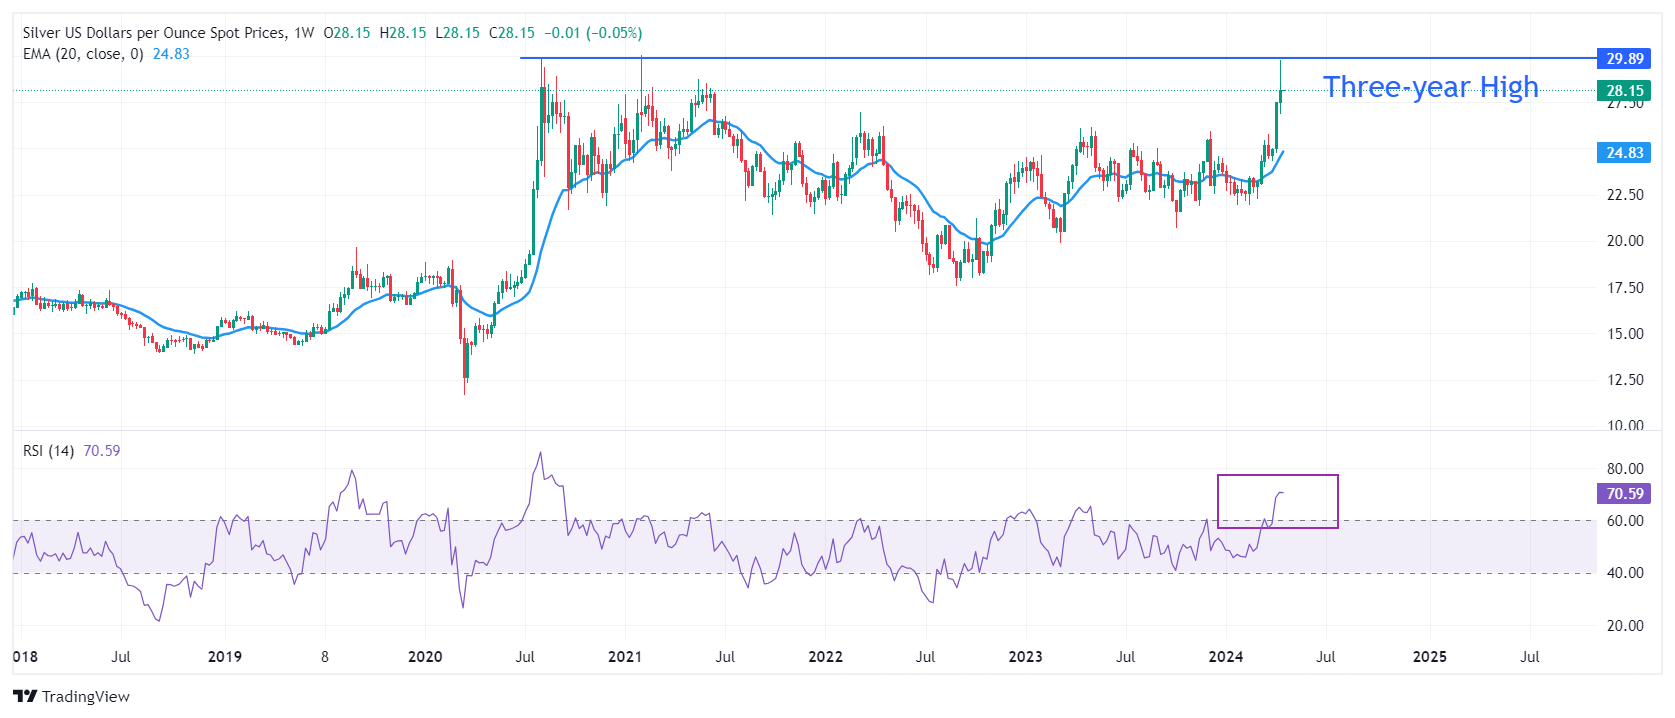
Silver price recaptures a three-year high near $30.00. The long-term outlook of the Silver price is extremely bullish as the 20-week Exponential Moving Average (EMA) near $25.00, is sloping higher. The 14-period Relative Strength Index (RSI) shifts into the bullish range of 60.00-80.00, suggesting that a bullish momentum is active.
Silver weekly chart
-
15.04.2024 08:36Silver Price Analysis: XAG/USD climbs closer to mid-$28.00s, remains below YTD top set on Friday
- Silver regains positive traction and reverses a part of Friday’s retracement slide from the YTD peak.
- The RSI on the daily chart is flashing overbought conditions and warrants caution for bullish traders.
- Any meaningful slide might continue to attract fresh buyers and is more likely to remain cushioned.
Silver (XAG/USD) catches fresh bids on the first day of a new week and stalls its retracement slide from the vicinity of the $29.80 region, or the highest level since February 2021 touched on Friday. The white metal sticks to intraday gains through the early part of the European session and is currently placed just below mid-$28.00s.
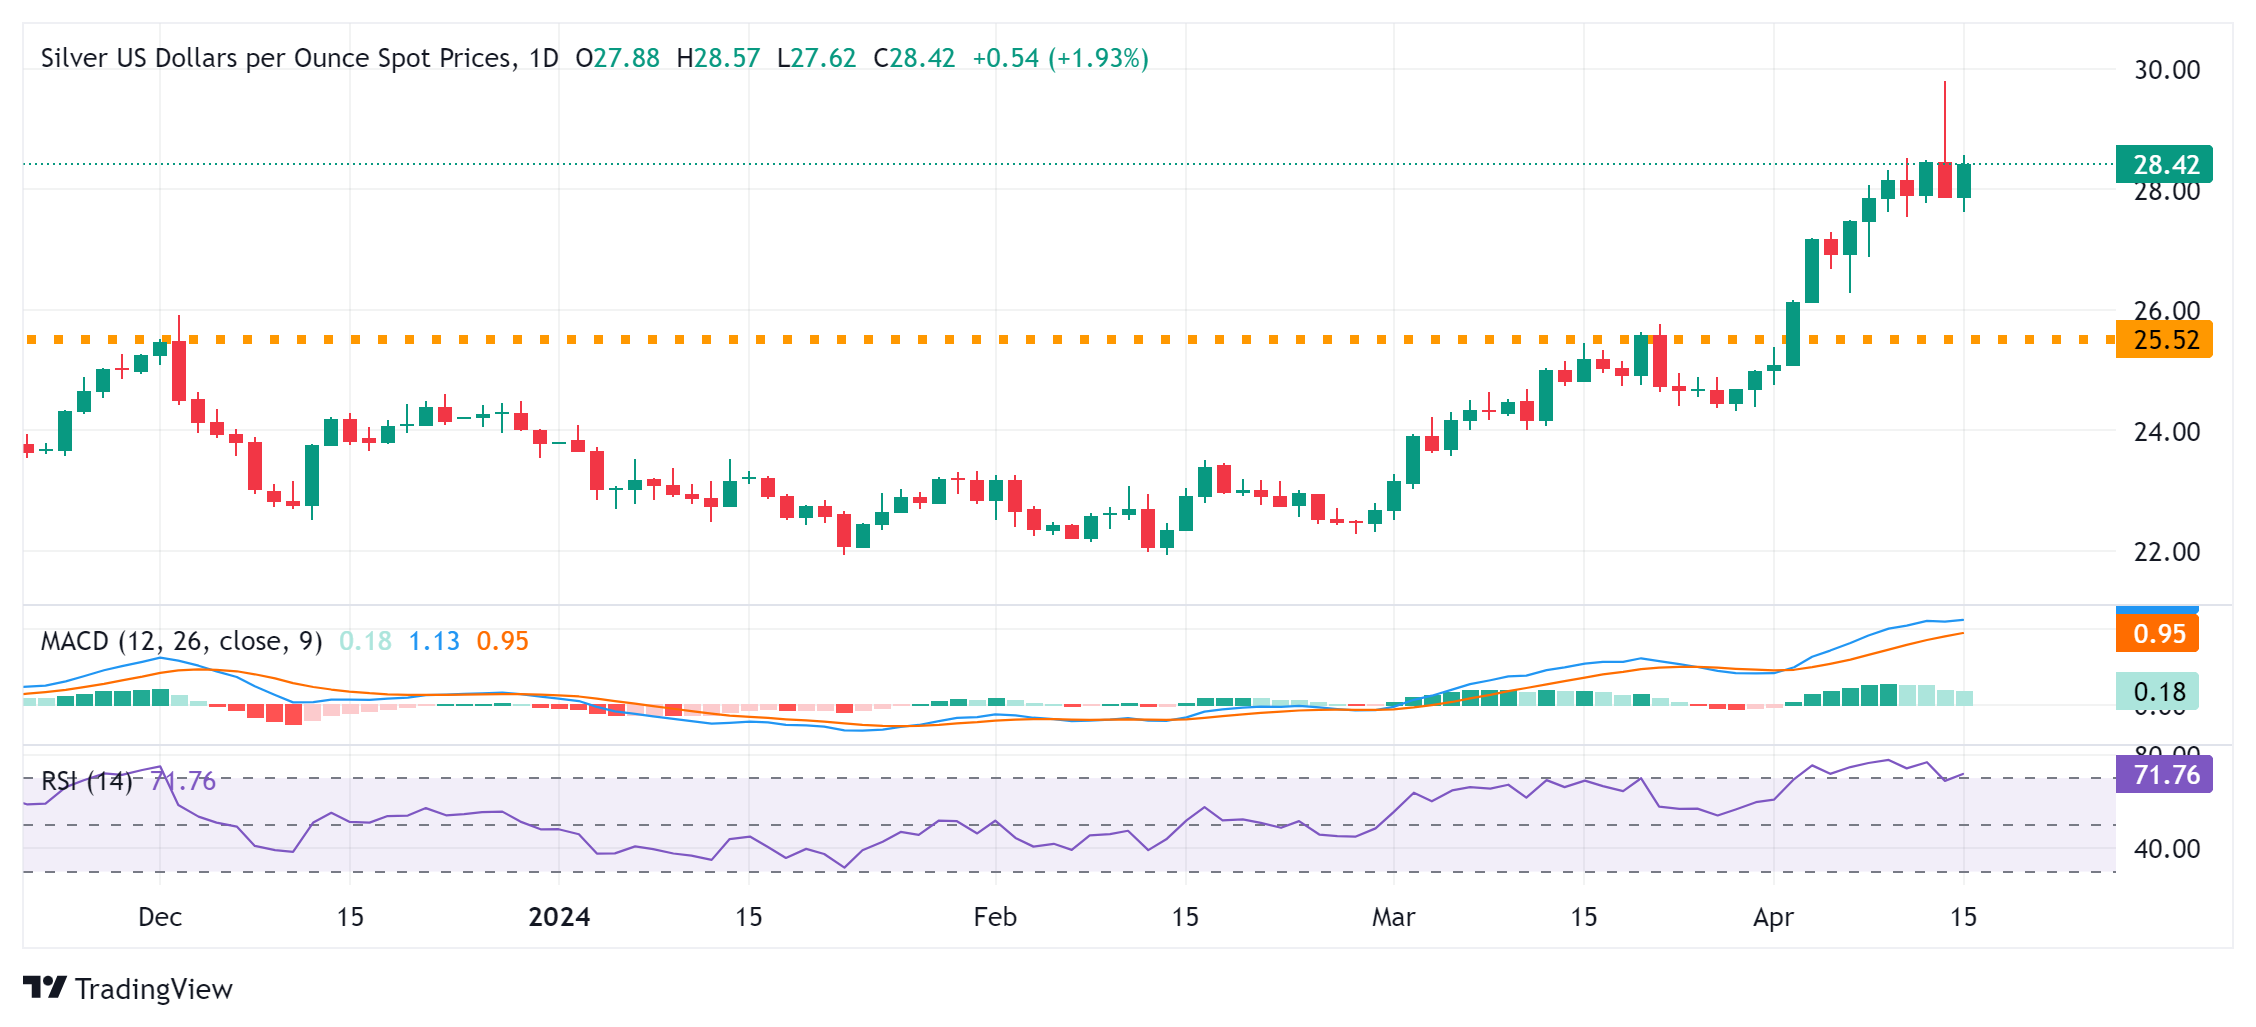
From a technical perspective, the recent breakout through the $25.60-$25.70 horizontal resistance and the subsequent move up was seen as a fresh trigger for bullish traders. That said, the Relative Strength Index (RSI) is flashing overbought conditions on the daily chart and makes it prudent to wait for some near-term consolidation or a modest pullback before positioning for any further appreciating move.
Meanwhile, any corrective decline below the $28.00 round figure is likely to find decent support near the $27.80-$27.75 region, below which the XAG/USD could accelerate the fall towards the $27.25 area en route to the $27.00 mark. Some follow-through selling might expose the next relevant support near the $26.35-$26.30 region before the white metal drops to the $26.00 mark and the $25.70-$25.60 resistance breakpoint.
On the flip side, sustained strength back above the $28.50 level should allow the XAG/USD to reclaim the $29.00 mark. The momentum could extend further towards the $29.80 zone, or the YTD peak, above which bulls are likely to aim back towards conquering the $30.00 psychological mark.
Silver daily chart
-
12.04.2024 22:25Silver Price Analysis: XAG/USD plummets after hitting three-year high, stays bullish
- Silver pulls back sharply from its highest point since February 2021, suggesting the rally might be overextended.
- If it breaks below key supports at $28.28 and $28.00, further declines to $27.54 and $27.00 could occur.
- A recovery above $28.00 could reignite bullish sentiment, aiming for previous highs and resistances.
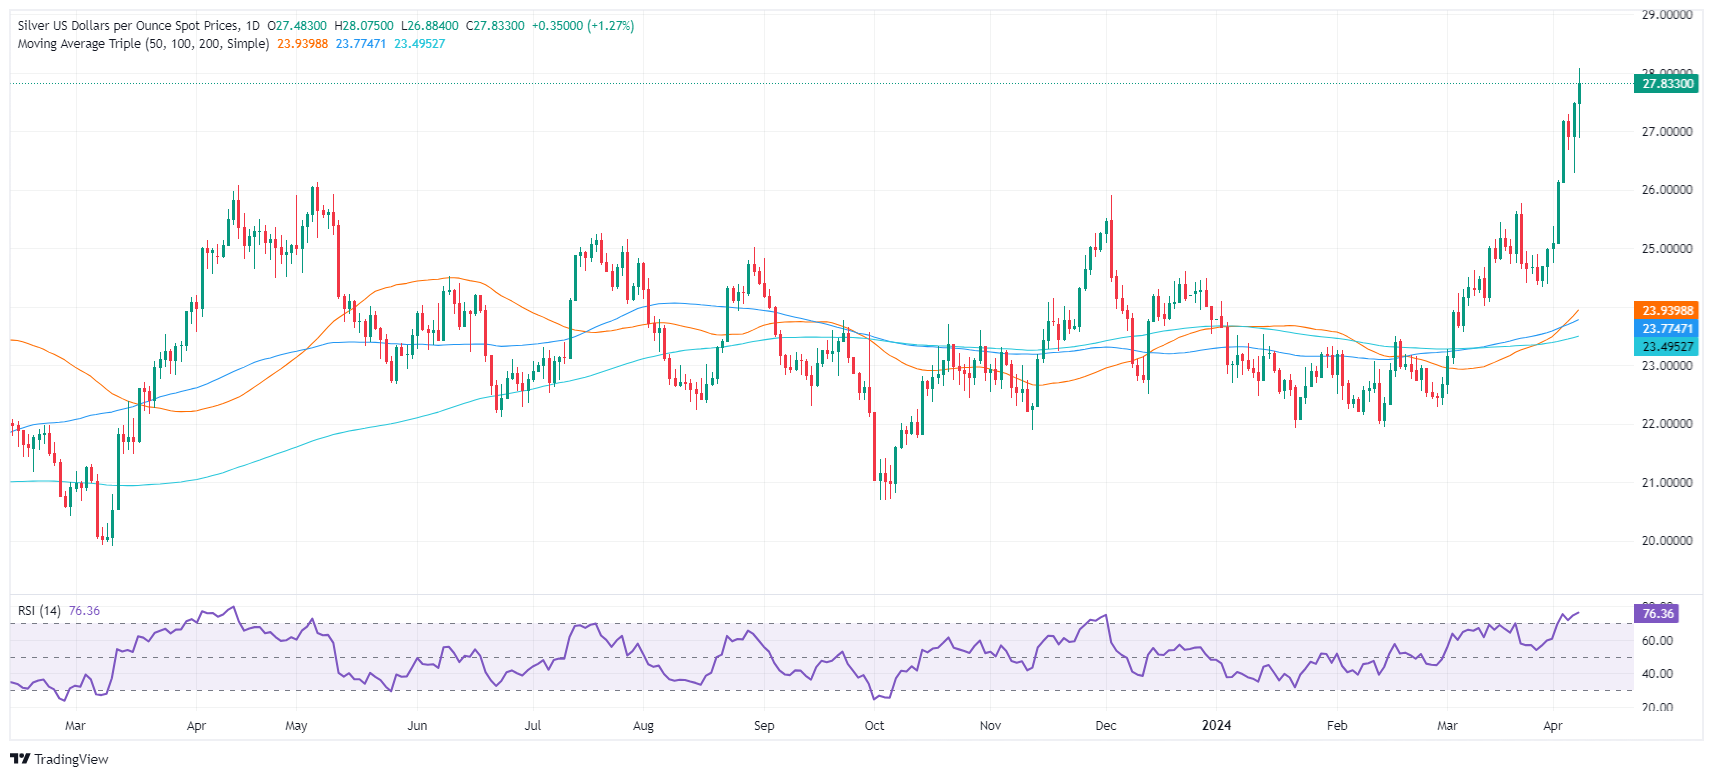
Silver's price tumbled on Friday’s session after refreshing three-year highs reached in February 2021. The grey metal peaked at $29.79 before plunging close to $2.00. The XAG/USD traded at $27.84, down 2.01%.
XAG/USD Price Analysis: Technical outlook
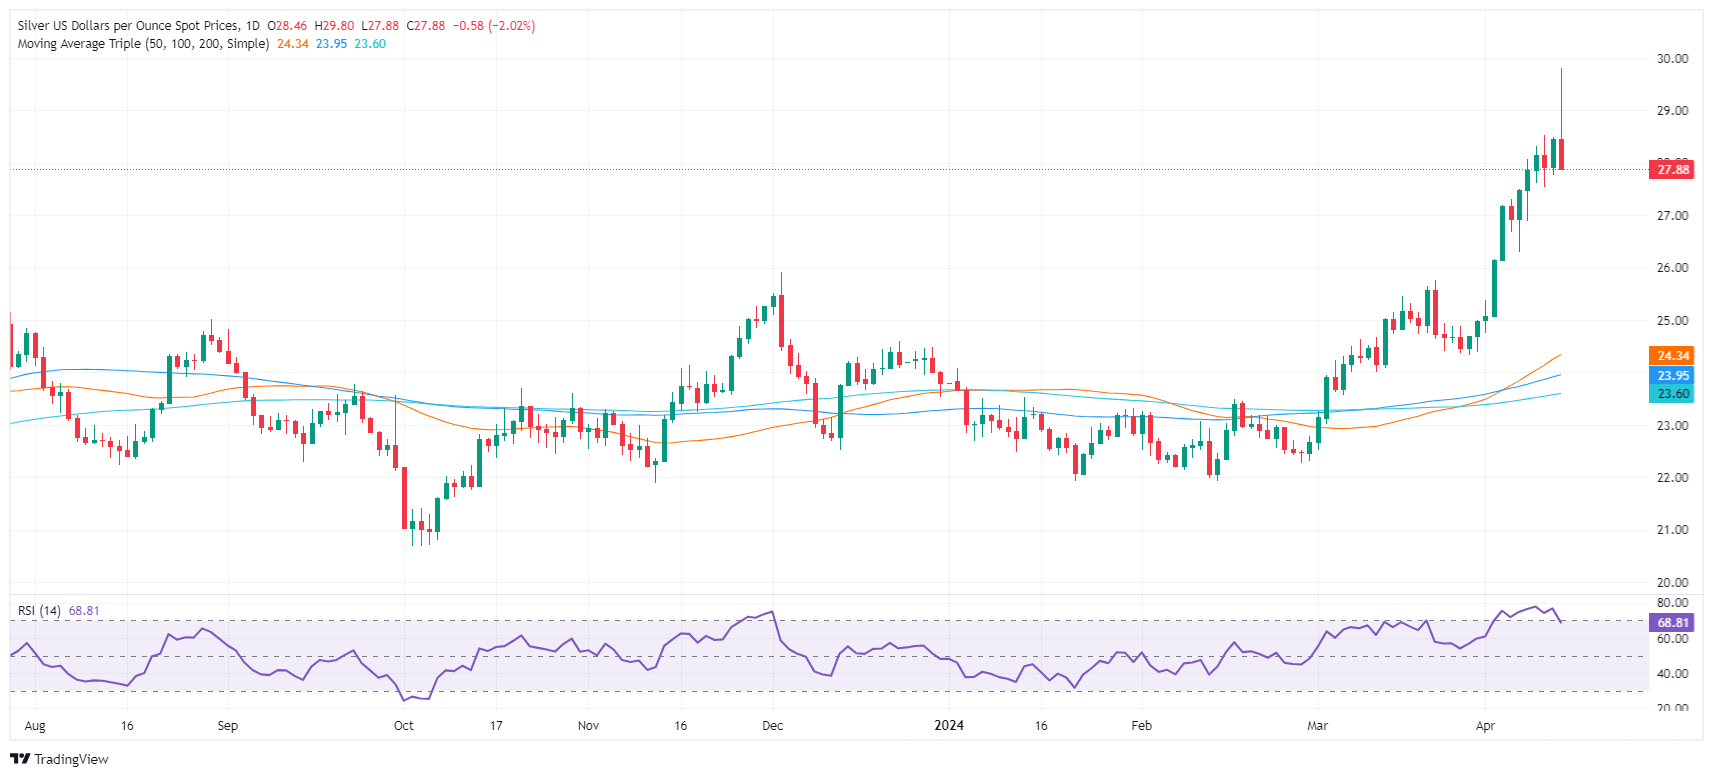
Silver is bullishly biased despite retreating sharply after spiking toward the $29.70s area. However, achieving a daily close below the June 10, 2021, high turned support at $28.28 and clearing below $28.00 has opened the door for a pullback. Therefore, XAG/USD's first support would be the April 10, low at $27.54, ahead of challenging the $27.00 figure. Further losses are seen on May 5, 2023, with high turned support at $26.12.
On the other hand, strong bullish momentum remains, and if buyers reclaim $28.00, that could be put back into the table, the continuation of the rally. The first supply zone would be June 10, 2021, high at $28.28, before testing May 18, 2021, at $28.74. Once surpassed, the next stop would be the year-to-date (YTD) high at $29.79.
XAG/USD Price Action – Daily Chart
-
12.04.2024 11:22Silver Price Analysis: XAG/USD sets for strong weekly gains on escalating geopolitical tensions
- Silver price rallies to $29, boosted by safe-haven demand due to geopolitical tensions.
- A decline in US yields has reinforced demand for non-yielding assets.
- The US Dollar advances as speculation for Fed rate cuts wanes.
Silver price (XAG/USD) looks set for a positive weekly close for the third time in a row. The precious metal strengthens as geopolitical tensions and China’s weak economic outlook strengthen safe-haven demand.
Iran promised to retaliate against Israel’s air strike on their embassy near Damascus in which seven members of its Islamic Revolutionary Guard Corps (IRGC), including two generals, were killed. The war situation in Gaza between Israel and Palestine could further escalate after the direct intervention of Iran. Meanwhile, the Israeli administration vowed to invade Rafah where displaced Palestinians have been sheltered. Investors channel their funds into non-yielding assets, such as Silver, amid geopolitical uncertainty.
Meanwhile, a sharp decline in US Treasury yields has reduced the opportunity cost of investment in non-yielding assets. 10-year US Treasury yields retreat to 4.55% from a more than four-month high of 4.60%. The US Dollar Index (DXY) is an inch away from recapturing a five-month high at 106.00.
The US Dollar strengthens as stubbornly higher consumer price inflation and strong Nonfarm Payrolls (NFP) data for March have forced traders to unwind their bets leaned toward the Federal Reserve (Fed) to begin reducing interest rates in the June and July policy meetings. Now, investors see the Fed pivoting to rate cuts from September. Also, investors expect that the Fed will reduce interest rates only two times by the year-end instead of three projected by Fed policymakers in the latest dot plot.
Silver technical analysis
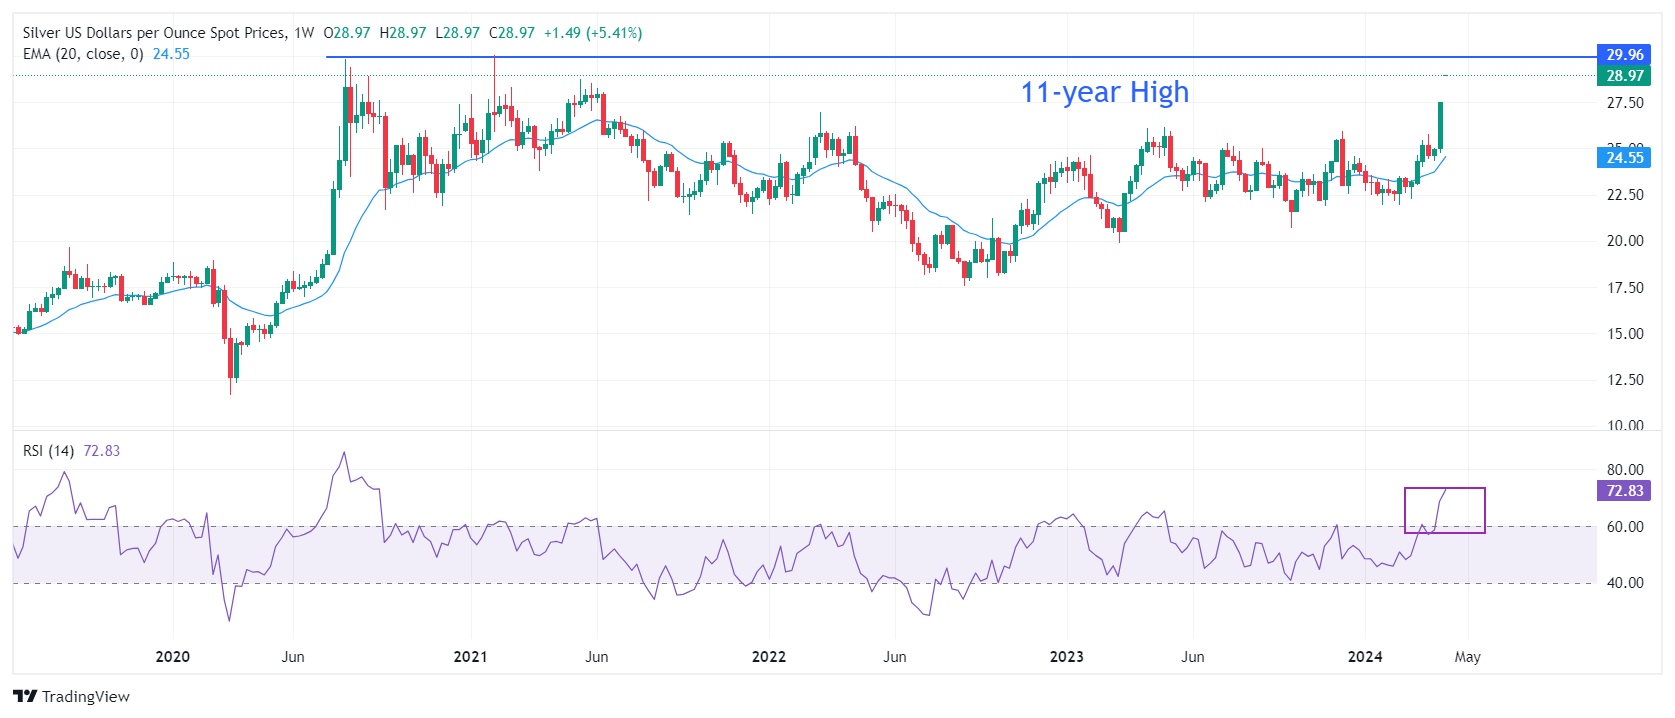
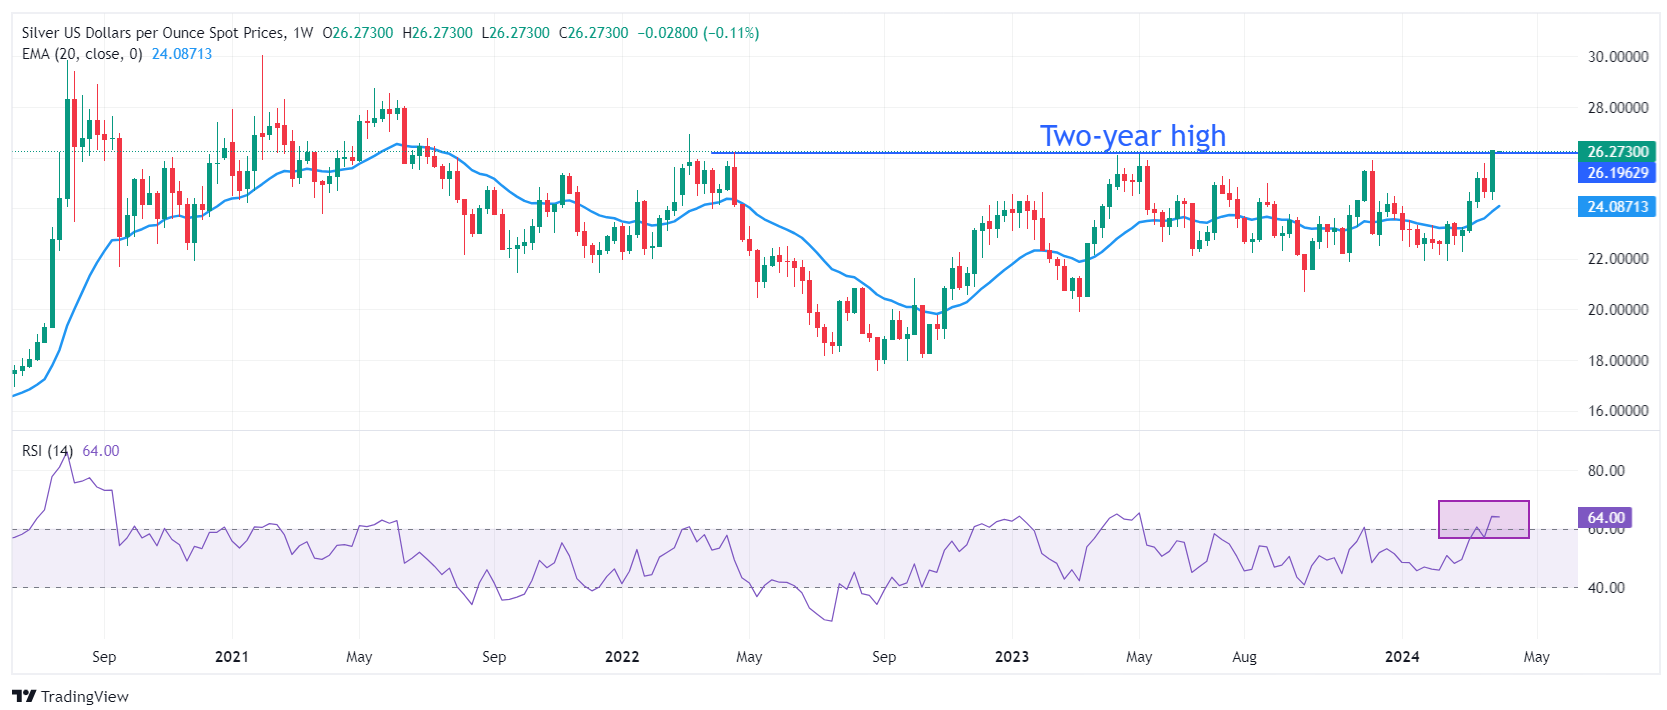
Silver price approaches an 11-month high near $30, plotted from 27 July 2020 high on a weekly timeframe. The long-term outlook is bullish as the 20-week Exponential Moving Average (EMA) at $24.56 is sloping higher. The 14-period Relative Strength Index (RSI) rises to 73.00, suggesting strong buying momentum. More upside remains favored amid the absence of divergence signals.
Silver weekly chart
-
11.04.2024 22:30Silver Price Analysis: XAG/USD rallies above $28.00 as bullish trend is intact
- Silver surges, bolstered by easing US producer prices, sparking interest in precious metals.
- Though overbought, strong bullish momentum could target the next resistance at $28.74.
- Support established at $28.00 and $27.54, key during potential pullbacks.
Silver price surges on Thursday after the release of prices paid by producers in the United States (US) showed that factory inflation continues to decelerate, contrasting Wednesday’s red-hot Consumer Price Index (CPI). Investors capitalized on that, as they took advantage of the dip in precious metals and lifted their prices near year-to-date peaks.
The XAG/USD trades at $28.45 and clocks minimal gains of 0.09% after ending Thursday’s session up by 1.94%.
XAG/USD Price Analysis: Technical outlook
The grey metal rally is set to extend after rallying after June 10, 2021, at a high of $28.28, which has opened the door for further upside. Silver gains momentum, although momentum oscillators suggest it's overbought. The Relative Strength Index (RSI), at 77.41, is still shy of reaching the 80 levels sought by traders as the overbought condition in a strong bullish trend.
With that said Silver’s next resistance would be the May 18 high at $28.74, followed by the psychological $29.00 figure. On the other hand, if sellers drag prices below the June 10, 2021, high, turned support, that will pave the way for further losses. The first support would be $28.00, followed by the April 10 low of $27.54, ahead of $27.00.
XAG/USD Price Action – Daily Chart
-
11.04.2024 06:58Silver Price Forecast: XAG/USD retreats from nearly three-year high to below $28.00
- Siver price loses momentum near $27.85 on the stronger USD on Thursday.
- Precious metals traders do not seem too concerned about U.S. inflation reports that came in higher than expected.
- Rising industrial demand and escalating geopolitical tensions in the Middle East boost the silver price.
Siver price (XAG/USD) trades with mild losses around $27.85 after retracing from the fresh three-year high of $28.53 during the early European session on Thursday. The lower speculation that the Federal Reserve (Fed) will cut the interest rate in June drags the gray metal lower. Investors await the US March Producer Price Index (PPI) on Thursday for fresh impetus.
Traders slashed bets on Fed interest rate cuts on Wednesday after US inflation was hotter than expectations and US President Joe Biden acknowledged that there was more work to be done to combat rising prices. The US Consumer Price Index (CPI) report in March suggested that the path of easing inflation remains extremely bumpy and the US central bank is likely to maintain the higher-for-longer rate narrative. This might limit the upside of silver as the gray metal becomes less attractive compared to interest-bearing assets. Fed Funds Futures market pushed expectations for the first rate cut from June to September, according to the CME FedWatch Tool.
On the other hand, rising industrial demand and its attraction to an alternative inflation hedge might cap the downside of silver prices. Additionally, the ongoing geopolitical tensions in the Middle East and its attraction to an alternative inflation hedge might lift silver prices in the near term as Israel and Hamas rejected ceasefire talks and Iran vowed retaliation for an airstrike on its embassy in Syria. -
10.04.2024 14:02Silver Price Forecast: XAG/USD slumps from two-year high near $28.30 on hot US Inflation data
- Silver price plummets to $27.85 as speculation for Fed pivoting to rate cuts erode.
- Hot US inflation data dent Fed rate cut prospects for June.
- Uncertainty over Fed’s three rate cut projections by the year-end deepens.
Siver price (XAG/USD) retreats from fresh two-year high of $28.36 after the United States Bureau of Labor Statistics (BLS) reported that the consumer price inflation turns out sticky. Hot inflation figures combined with strong payroll data for March have dented market expectations for the Federal Reserve (Fed) to begin lowering interest rates from the June meeting.
The annual headline Consumer Price Index (CPI) accelerated to 3.5% from expectations of 3.4% and the prior reading of 3.2%. Annual core inflation that excludes volatile food and energy prices rose steadily by 3.8%. Economists expected the most sought-after inflation measure to decelerate to 3.7%.
Fed policymakers have been reiterating that it is not appropriate to reduce interest rates until they get convinced that inflation will return sustainably to the 2% target. For inflation to return to 2%, the monthly inflation should increase at a pace of 0.17%. In March, both headline and core CPI rose steadily by 0.4% against expectations of 0.3%.
Going forward, traders are expected to shift their bets for the Fed beginning to reduce interest rates in the third quarter this year. Stubbornly higher inflation is expected to deepen uncertainty over three rate cut projections for this year as anticipated by Fed policymakers in the latest dot plot.
Hot CPI figures have led to a sharp increase in yields on interest-bearing assets, such as US bonds. 10-year US Treasury yields have risen to 4.48%. The US Dollar Index (DXY) rallies to the crucial resistance of 105.00.
Silver technical analysis
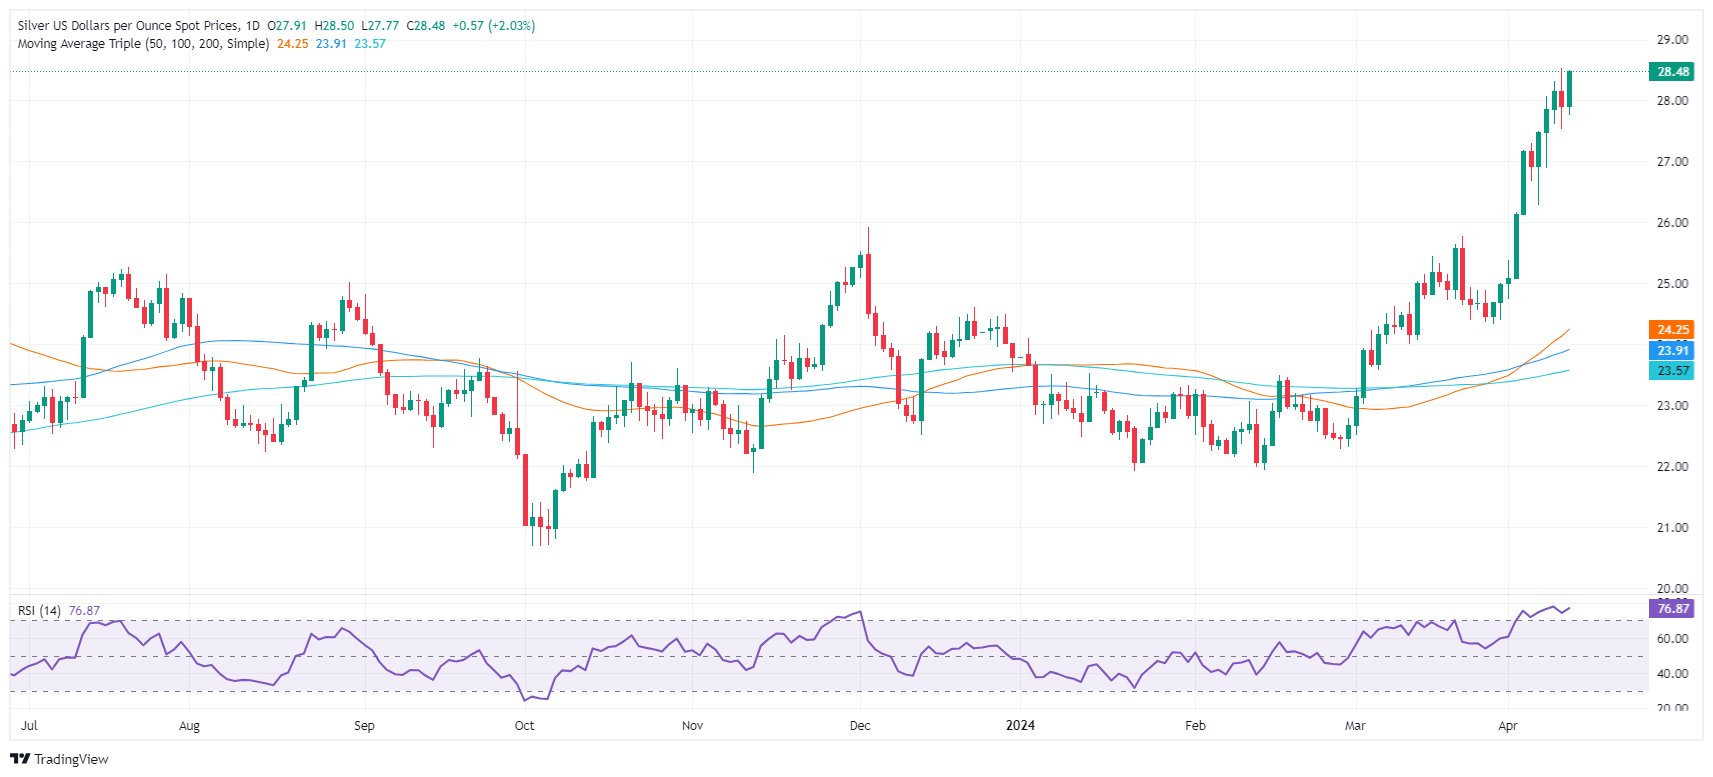
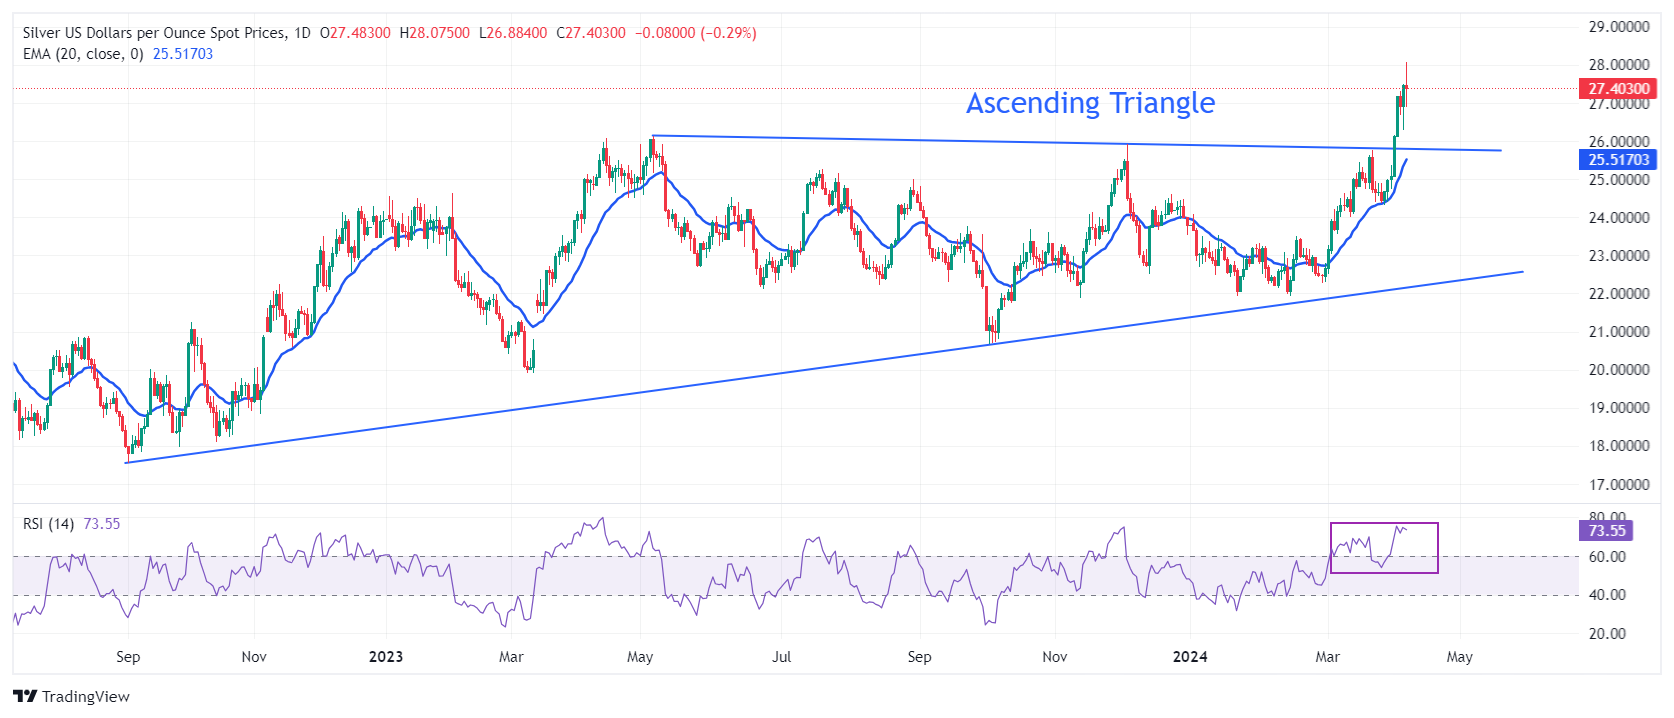
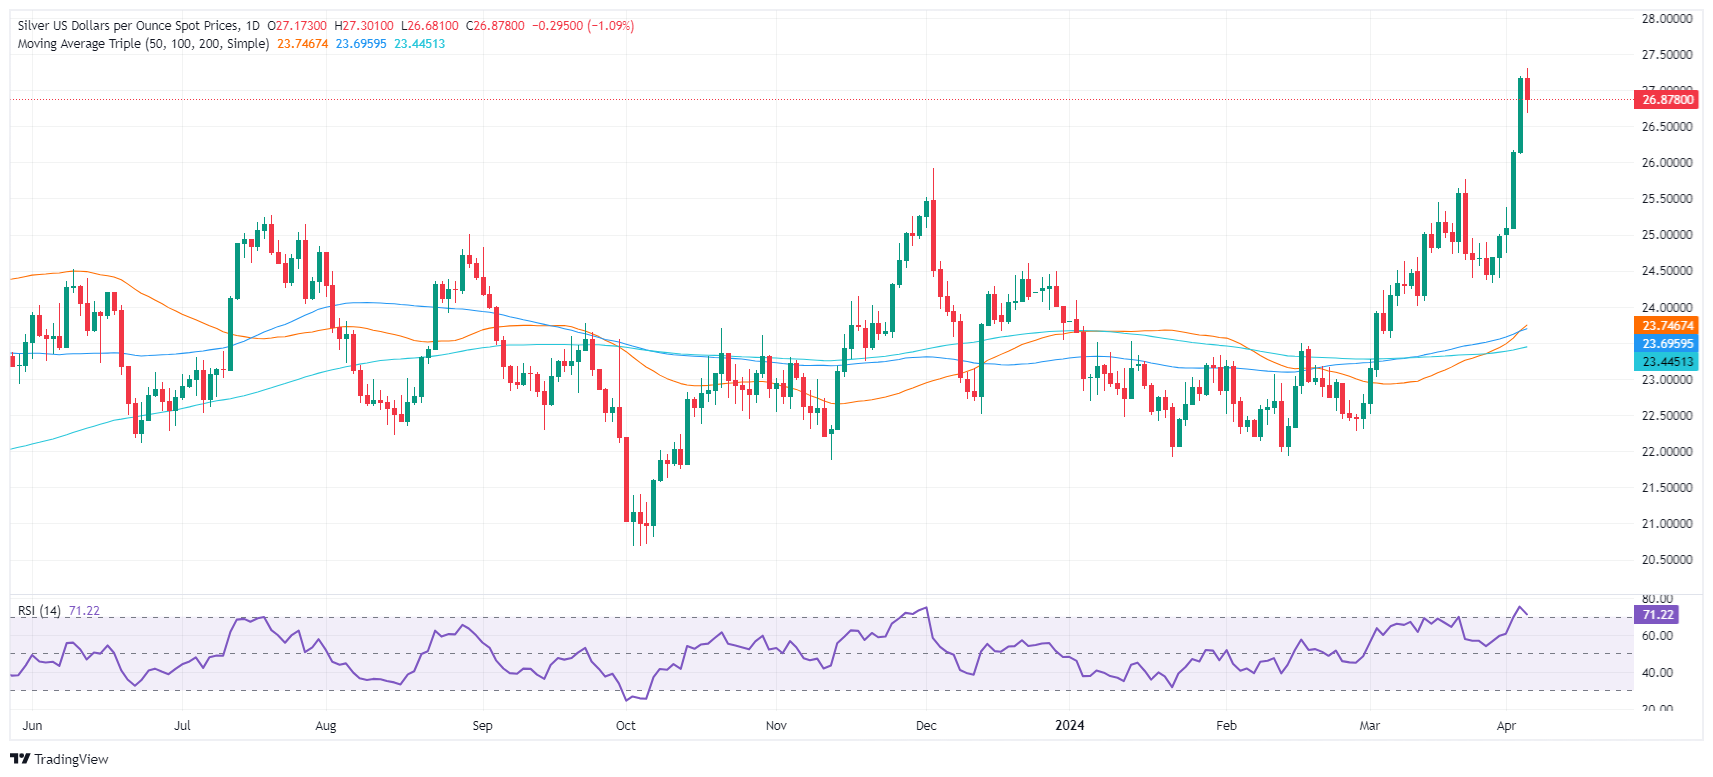
Silver price delivers a stalwart rally after a breakout of the Ascending Triangle chart pattern formed on a daily timeframe. The strength of the breakout will be tested if the white metal corrects to the horizontal resistance of the above-mentioned chart pattern plotted from 14 April 2023 high at $26.09. Upward-sloping 20-day Exponential Moving Average (EMA) at $26.00 suggests that the near-term demand remains upbeat.
The 14-period Relative Strength Index (RSI) drops after reaching 76.00, indicating that oscillators are cooling after turning extremely overbought.
Silver daily chart
-
10.04.2024 08:00Silver Price Forecast: XAG/USD treads water near $28.10 amid escalated geopolitical tension
- Silver price gains ground on expectations of Fed rate cuts in 2024.
- The non-yield asset like Silver appreciates as US Treasury yields decline.
- Israel's Foreign Affairs Minister, Israel Katz, affirmed that Israel would retaliate if Iran attacks its territory.
Silver price exhibits a sideways trend with positive sentiment to extend its gains for the fourth successive session, hovering around $28.10 per troy ounce during the early European session on Wednesday.
Silver price could appreciate further on expectations of rate cuts from the Federal Reserve (Fed) this year. The decline in US Treasury yields leads to supporting non-yielding assets like Silver, with 2-year and 10-year yields on US Treasury bonds standing at 4.74% and 4.36%, respectively, at the current press time.
Furthermore, the price of Silver follows the upward movement in Gold prices, supported by increased consumer and industrial demand. China's addition of 160,000 troy ounces of gold to its reserves in March, along with gold purchases by Turkey, India, Kazakhstan, and several Eastern European countries this year, further contributes to the positive sentiment surrounding precious metals.
The escalating geopolitical tensions in the Middle East are driving investors towards safe-haven assets like Silver. Israel's Foreign Affairs Minister, Israel Katz, issued a warning that Israel would retaliate if Iran attacks its territory. Additionally, peace talks between Israel and Hamas in Egypt have failed to make progress.
Investors adopt a cautious stance, anticipating potential policy shifts influenced by incoming data. Strong labor market figures from last week could prompt a more hawkish stance from the Federal Reserve if inflation exceeds expectations. This could potentially limit the upward momentum of Silver price.
-
09.04.2024 14:55Silver Price Forecast: XAG/USD soars to nearly three-year peak above $28.00
- Silver reaches $28.32, lifted by falling US Treasury yields, softer Dollar, despite Fed's hawkish view.
- Israel's PM comments add to geopolitical tensions, boosting precious metals.
- Market eyes US CPI for inflation insights; Fed vows to tackle inflation.
Silver rallied to an almost three-year high, with the grey metal breaching key resistance on June 10, 2021. Buyers are eyeing May 2021 highs. Factors like a soft US Dollar and falling US Treasury yields underpin the precious metal amid speculations of a less dovish Federal Reserve. The XAG/USD trades at $28.00 a troy ounce after hitting a new multi-month high of $28.32.
XAG/USD breaks past $28.00 as declining US Treasury yields and geopolitical uncertainties fuel demand for safe-haven assets
The sudden reversal in US Treasury yields has driven the rally in precious metals. After gaining 15 basis points in the last two trading days, the US 10-year benchmark note drops to 4.37%, losing five bps. That and a softer Greenback sponsored Silver’s last leg up above the $28.00 threshold.
Geopolitical risks weigh on the buck and underpin precious metals. Israel Prime Minister Benjamin Netanyahu revealed they will complete the elimination of Hamas brigades, including in Rafah, and nothing will prevent this, according to Reuters. In the meantime, Israel's ceasefire proposal was rejected by Hamas.
Market participants are looking for the release of the latest inflation report in the United States (US). The Consumer Price Index (CPI) is expected to ease from a monthly perspective, yet it’s foreseen to be higher than February’s data in yearly figures. Core CPI is projected to dip in both readings.
Federal Reserve’s policymakers had crossed the wires. The latest to cross newswires was Minnesota Fed Neil Kashkari, who said the US central bank can’t fall short on the inflation fight.
XAG/USD Price Analysis: Technical outlook
The daily chart suggests that XAG/USD might continue to rally past the $28.00 figure, though the Relative Strength Index (RSI), turning overbought, spurred a pullback. That could be seen as traders booking profits.
If the retracement continues, Silver’s next support would be $27.50, ahead of testing the April 8 low of $26.87. On the other hand, a resumption of the uptrend would pave the way to test $28.32, ahead of climbing toward $29.00.
-
09.04.2024 07:46Silver Price Forecast: XAG/USD rises to near $28.00, tracking rally in gold
- Silver price follows the rally in gold as global central banks increase their reserves.
- The price of Silver has advanced to its highest level since June 2021.
- The eased geopolitical situation in the Middle East could have limited the advance of Silver price.
Silver price advances for the third consecutive session, trading higher to near $28.00 per ounce during the early European hours on Tuesday. This surge in Silver price mirrors the rally in gold, driven by heightened consumer and industrial demand. Global central banks increasing their reserves in gold have also contributed to the increased appetite for precious metals.
Furthermore, the demand for non-yielding assets like silver is bolstered as US Treasury yields correct after two days of gains. At present, the 2-year and 10-year yields on US Treasury bonds stand at 4.78% and 4.39%, respectively.
Traders eagerly await the release of the US Consumer Price Index data scheduled for Wednesday. It is anticipated that the US headline CPI will accelerate in March, while the core measure is expected to show a cooling down. The industrial outlook for metals received a boost from strong manufacturing data from top consumer China and projections for increased solar installations.
However, Silver price could have faced downward pressure as geopolitical tensions have eased in the Middle East, following the withdrawal of most Israel Defense Forces from southern Gaza, possibly due to growing international pressure, has contributed to easing tensions. Additionally, peace talks between Israel and Hamas have resumed in Egypt
Traders will now shift their focus to the upcoming US inflation data and the release of FOMC minutes this week to gain more clarity on the timing of the Fed's monetary policy adjustments.
-
08.04.2024 20:08Silver Price Analysis: XAG/USD rally continues amid demand of precious metals
- Silver's rise mirrors growing precious metals interest, fueled by global central bank moves.
- Overbought RSI hints at consolidation before aiming higher, reflecting market optimism.
- Upcoming targets: $28.00 resistance, June 2021 peak, signaling potential for more gains.
Silver’s price rose for the second straight day, climbing to $27.80, gaining more than 1% in late trading on Monday’s North American session, even though US Treasury bond yields advanced. Even though speculations that the US Federal Reserve could cut twice instead of three times were no excuse for the grey’s metal advance linked to Gold’s rally. Appetite for precious metals increased as global central banks increased their reserves in Gold.
XAG/USD Price Analysis: Technical outlook
The rally in the precious metals is set to continue, with the grey’s metal set to extend its gains past the $28.00 figure. Although the Relative Strength Index (RSI) suggests that Silver is overbought, it could consolidate at around the $27.00-$28.00 range, before achieving its next leg up.
Stir resistance lies at $28.00, followed by the June 10 , 2021 peak at around $28.28. Further upside is seen at $29.00.
XAG/USD Price Action – Daily Chart
-
08.04.2024 14:26Silver Price Forecast: XAG/USD hovers near two-year high around $28 despite higher bond yields
- Silver price exhibits strength around $28 despite traders pare Fed rate cut bets for June.
- Fed Bowman said current conditions are not appropriate for lowering borrowing rates.
- The US Dollar awaits the US inflation data for fresh guidance.
Silver price (XAG/USD) faces a nominal sell-off after printing a fresh two-year high around $28.00 in Monday’s early New York session. The near-term demand for the white metal remains strong even though US Treasury yields soar after upbeat United States Nonfarm Payrolls (NFP) data for March dent speculation for the Federal Reserve (Fed) lowering borrowing rates from the June meeting. 10-year US Treasury yields rise to 4.43%.
Strong labor demand is offset by higher wage offerings, which leads to robust consumer spending that fuels consumer price inflation. After the US NFP release, Fed Governor Michelle Bowman said, “We are still not yet at the point where it is appropriate to lower the policy rate, and I continue to see a number of upside risks to inflation.”
Fed policymakers have been reiterating that there is no urgency for rate cuts. Policymakers need good inflation data for months before pivoting to rate cuts.
The US Dollar Index (DXY) falls slightly to 104.24 but remains inside Friday’s trading range. The USD index stays on the sidelines as the focus shifts to the consumer price inflation data for March, which will be published on Wednesday.
The core CPI that strips off volatile food and Oil prices is estimated to have dipped slightly to 3.7% from 3.8%. A more-than-anticipated decline in the US inflation data will prompt Fed rate cut expectations for the June meeting.
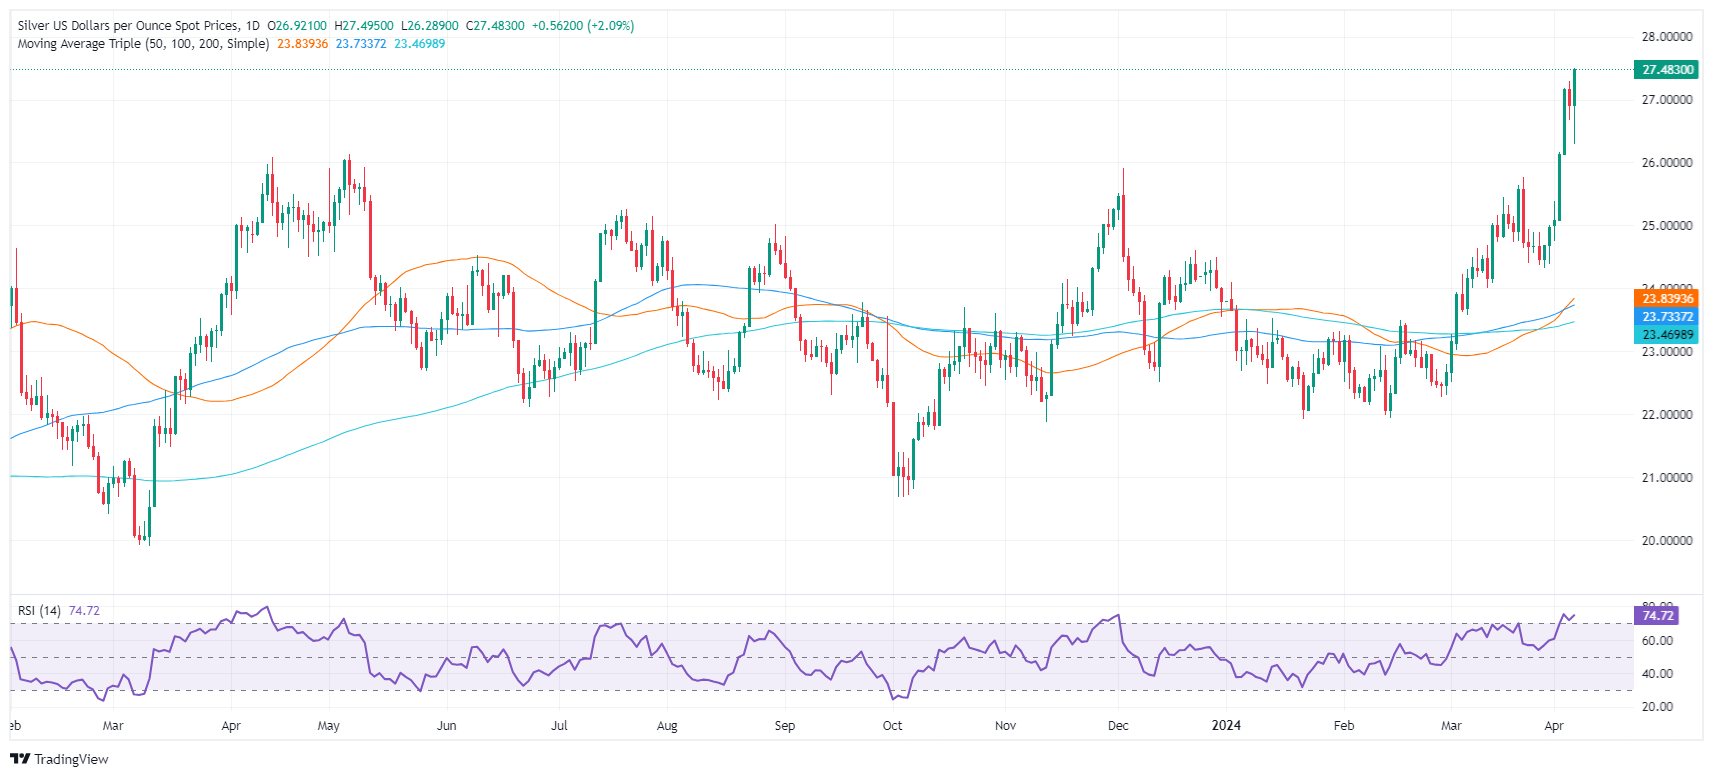
Silver technical analysis
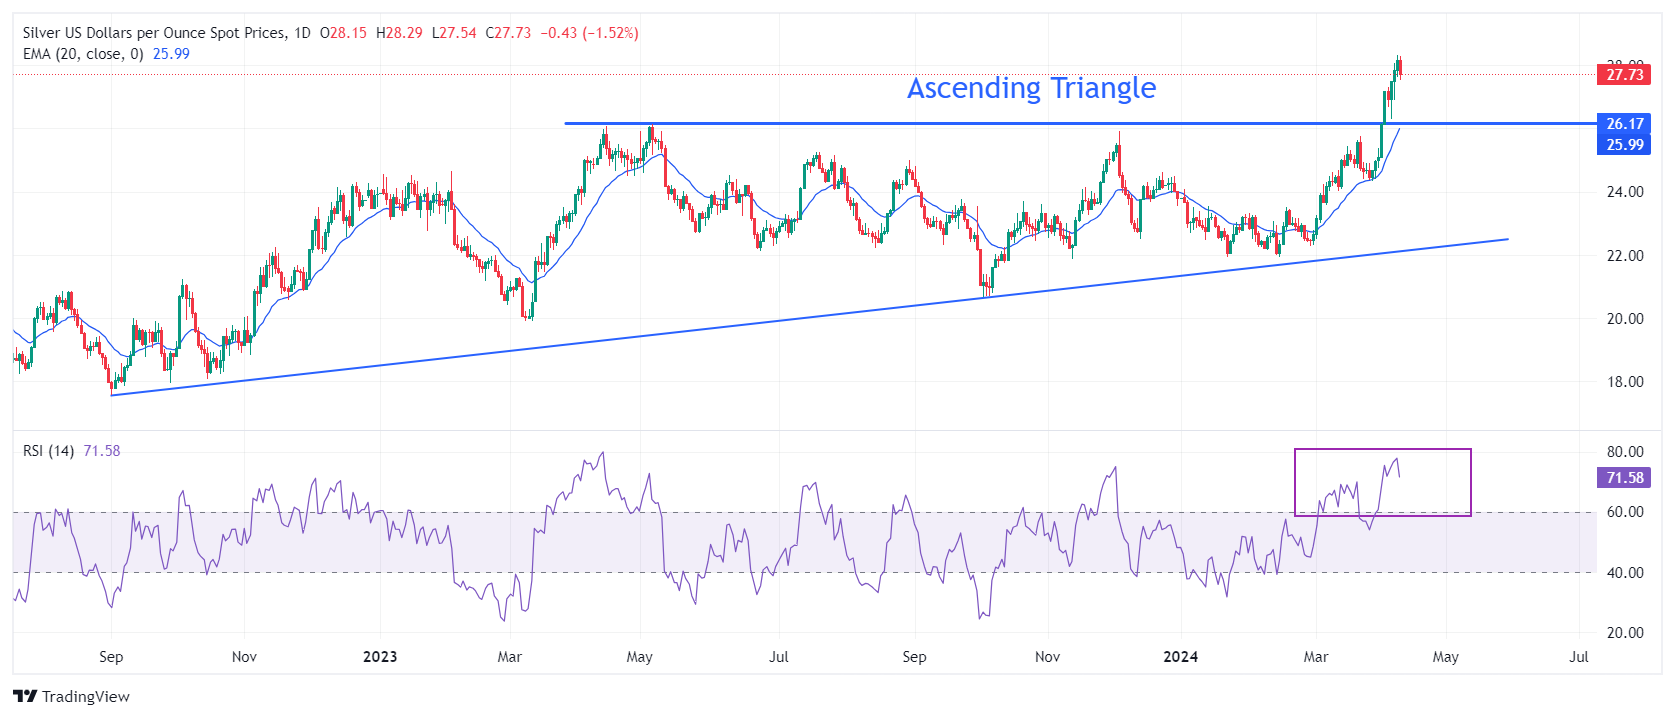
Silver price sees a sharp upside after a breakout of the Ascending Triangle pattern formed on daily timeframe. The aforementioned chart pattern exhibits sharp volatility contraction but a decisive breakout leads to heavy volume and wider ticks on the upside. The horizontal resistance of the above-mentioned chart pattern, placed from May 5 high at $26.13, has turned into a crucial support for the Silver price bulls.
Advancing 20-day Exponential Moving Average (EMA) near $25.50 keeps the near-term demand strong.
The 14-period Relative Strength Index (RSI) oscillates in the bullish range of 60.00-80.00, indicating a strong momentum leaned to the upside.
Silver daily chart
-
05.04.2024 22:44Silver Price Analysis: XAG/USD peaks to new three-year high above $27.00
- Silver's surge to multi-year highs reflects strong precious metals momentum, undeterred by US job market.
- Technical outlook hints at more gains, with resistances at $27.50, $28.00.
- RSI dip may prompt support tests at $27.00, $26.12 for future direction clues.
Silver soared sharply and finished the week with gains of close to 10%, hitting three-year highs after reaching levels last seen in June 2021. At the time of writing, XAG/USD trades at $27.45 a troy ounce, gaining more than 2%.
The precious metals segment ignored an upbeat US jobs report that might delay the Federal Reserve from slashing rates in the June meeting. According to the CME FedWatch Tool, market participants decreased their bets on a quarter-percentage-point rate cut in June, though July remains in play. Silver followed Gold’s path, though the latter is trading at all-time highs.
XAG/USD Price Analysis: Technical outlook
The grey metal daily chart shows Silver dipped as low as $26.29 after the US NFP release but, in the aftermath, rallied to multi-year highs. The Relative Strength Index (RSI) despite being at overbought conditions, aims up, an indication that buyers are gathering momentum. That said, XAG/USD next resistance would be $27.50, followed by the $28.00 psychological mark. Key resistance lies at June 10, 2021, high at $28.28.
On the other hand, if the RSI punches below the 70 level, that could sponsor a pullback, toward the $27.00 figure. The next support would be the May 5, 2023 high turned support at $26.12, followed by the $26.00 figure.
XAG/USD Price Action – Daily Chart
-
05.04.2024 08:37Silver Price Analysis: XAG/USD finds support near $26.60 after a sharp correction ahead of US NFP
- Silver price finds cushion near $26.60 amid correction ahead of US NFP report.
- The US NFP report will influence market expectations for Fed rate cuts in June.
- Deepening Middle East tensions keep near-term demand for Silver intact.
Silver price (XAG/USD) discovers support near $26.60 after a pullback from more than two-years high of $27.34. The white metal takes a breather after a strong rally as investors turn cautious ahead of the United States Nonfarm Payrolls (NFP) report for March, which will be published at 12:30 GMT.
According to the expectations, fresh payrolls were 200K, lower than the former reading of 275K. The Unemployment Rate is expected to come out steady at 3.9%.
Investors will also focus on the Average Hourly Earnings data, which will provide fresh inflation outlook. The monthly wage growth is forecasted to have grown at a higher pace of 0.3% from 0.1% in February. In the same period, the annually wage growth is estimated to have dipped to 4.1% against 4.3%.
Strong labor demand and higher wage growth would allow the Federal Reserve (Fed) to delay rate cut plans while signs of labor market conditions easing will boost rate cut hopes for the June meeting. The US Dollar Index (DXY) stabilizes after recovering from two-week low of 103.90 ahead of the US NFP report.
The demand for Silver is bullish in the longer horizon due to deepening Middle East tensions. Air strikes from Israel forces on Iranian embassy in Damascus, situated near Syria’s capital, has deepened fears of Iran’s participation to Israel-Palestine war.
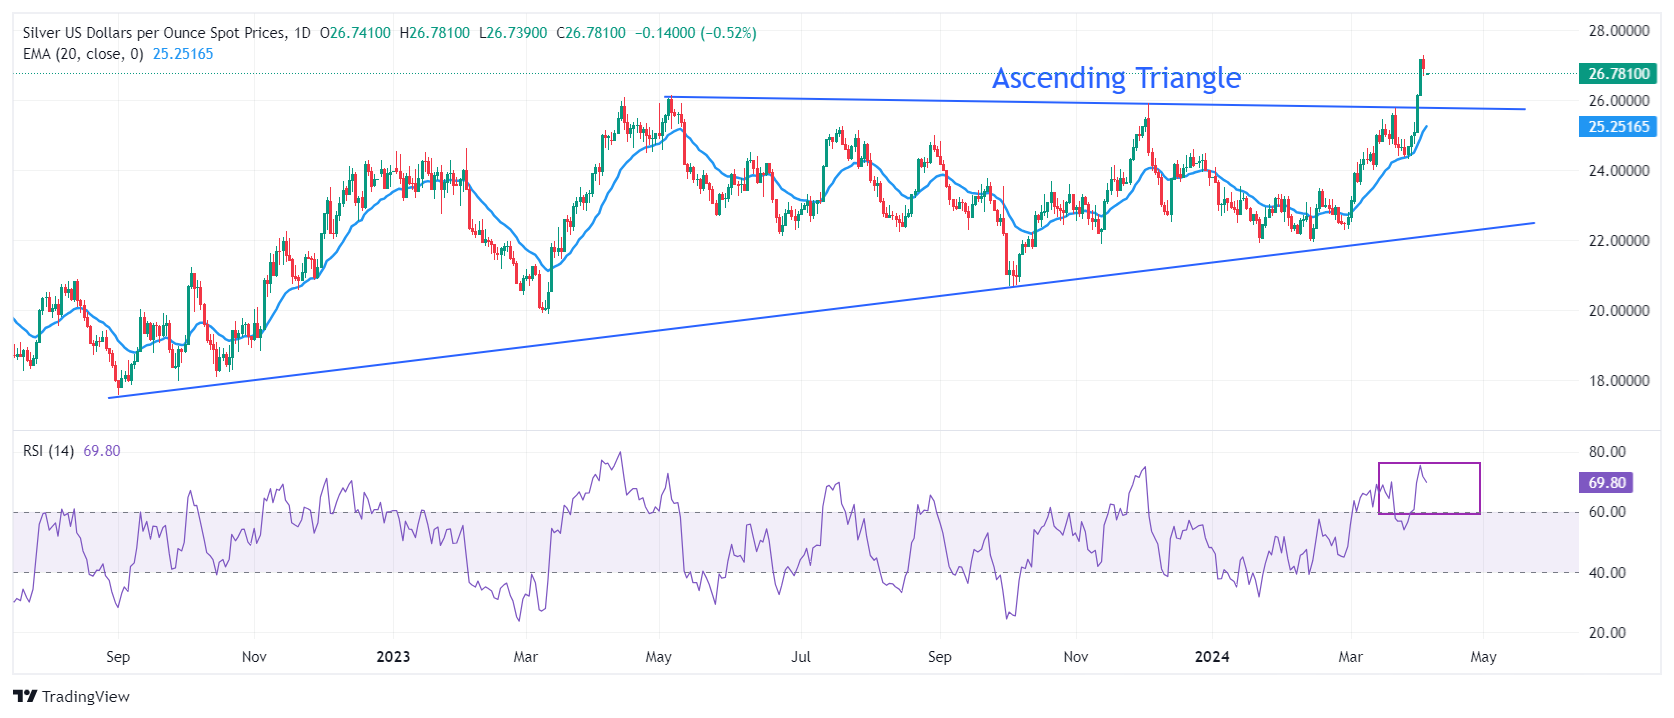
Silver technical analysis
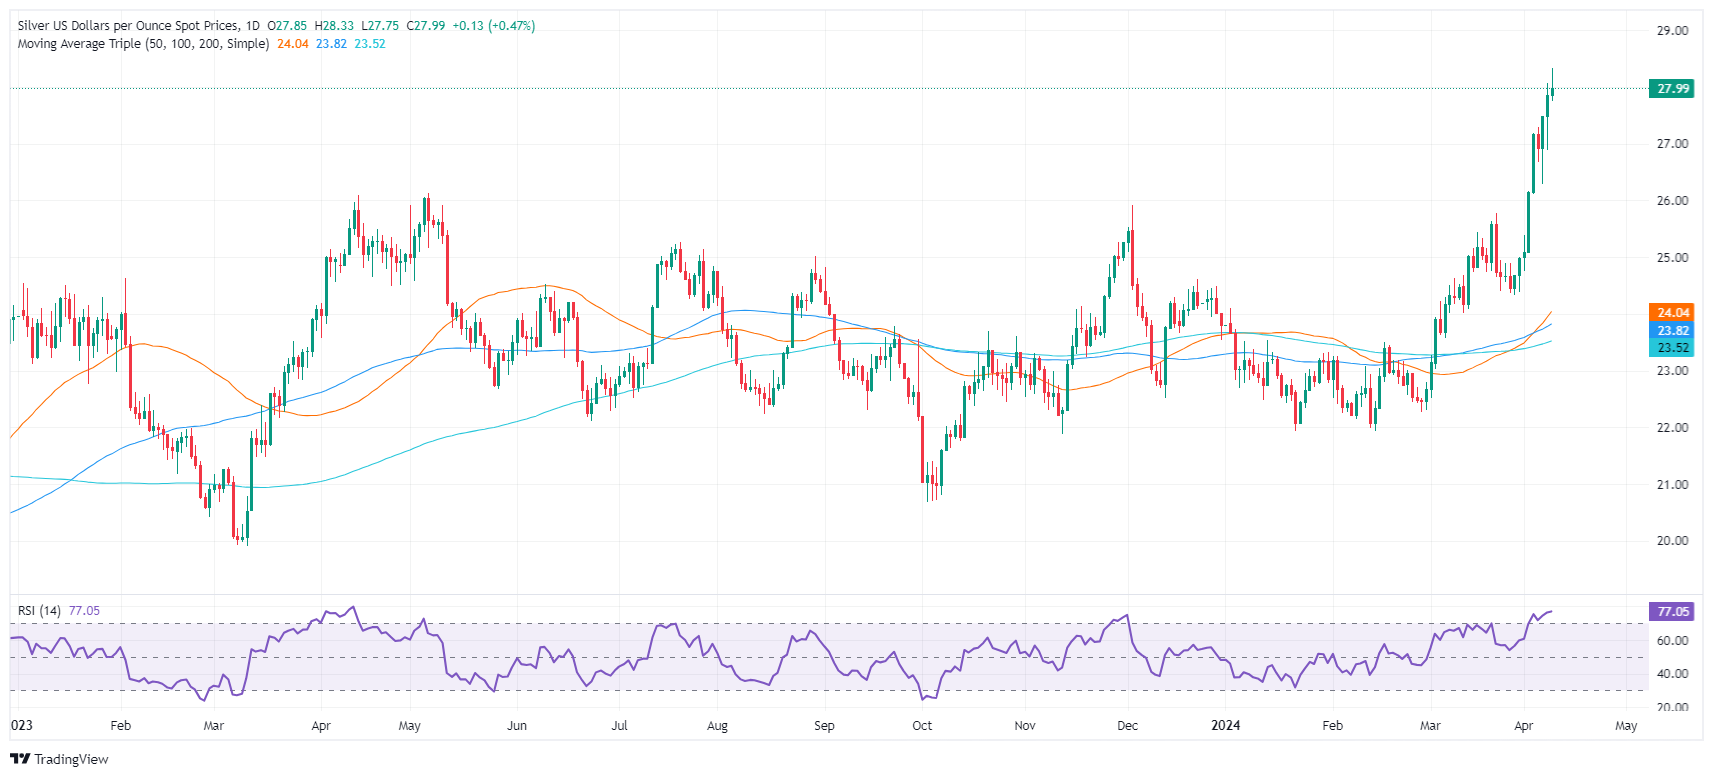
Silver price saw a stalwart rally after a breakout of the Ascending Triangle pattern formed on daily timeframe. The aforementioned chart pattern exhibits sharp volatility contraction but a decisive breakout leads to heavy volume and wider ticks on the upside. The horizontal resistance of the above-mentioned chart pattern, placed from May 5 high at $26.13, has turned into a crucial support for the Silver price bulls.
Advancing 20-day Exponential Moving Average (EMA) near $25.25 keeps the near-term demand unabated.
The 14-period Relative Strength Index (RSI) oscillates in the bullish range of 60.00-80.00, indicating a strong momentum leaned to the upside.
Silver daily chart
-
04.04.2024 20:32Silver Price Analysis: XAG/USD dips below $27.00 after hitting multi-year high
- Silver pulls back from $27.33 amid geopolitical concerns, market caution.
- Bullish trend holds, with supports at $25.91, $25.08.
- Rebound above $27.00 may target recent high, with eyes on $28.00, subject to market shifts.
Silver’s retreats after hitting a two-and-a-half-year high of $27.33 amid growing speculations of geopolitical risks due to Israel’s attack on Iran’s embassy in Syria. That has triggered a late risk-off impulse, which is weighing on the precious metals, including Gold. The XAG/USD is down more than 1% and trades at $26.84.
XAG/USD Price Analysis: Technical outlook
Silver’s remain upward biased as depicted by successive series of higher highs and higher lows, despite retreating as of writing. If sellers would like to regain control, they must drag XAG/USD’s prices toward the December 4 high turned support at $25.91. Once surpassed, the next stop would be the April 2 low at $25.08 before plummeting toward March 27’s low of $24.33.
On the other hand, if buyers push Silver’s spot price above $27.00, look for a re-test of the year-to-date (YTD) high at $27.33 before rallying to $28.00.
XAG/USD Price Action – Daily Chart
-
04.04.2024 07:38Silver Price Forecast: XAG/USD pulls back from all-time highs, hovers around $27.00
- Silver price could find a key support area around the major level of $27.50, following the psychological level of $26.00.
- Technical analysis suggests confirmation of the bullish sentiment.
- The immediate resistance zone appears around the all-time high of $27.33 and the major support at $27.50.
Silver price attempts to snap its five-day winning streak, retreating from the all-time highs and trading near $27.00 per troy ounce during early European hours on Thursday. The price of the Silver received upward support as the US Dollar lost ground due to the dovish sentiment surrounding the Federal Reserve’s (Fed) interest rates trajectory.
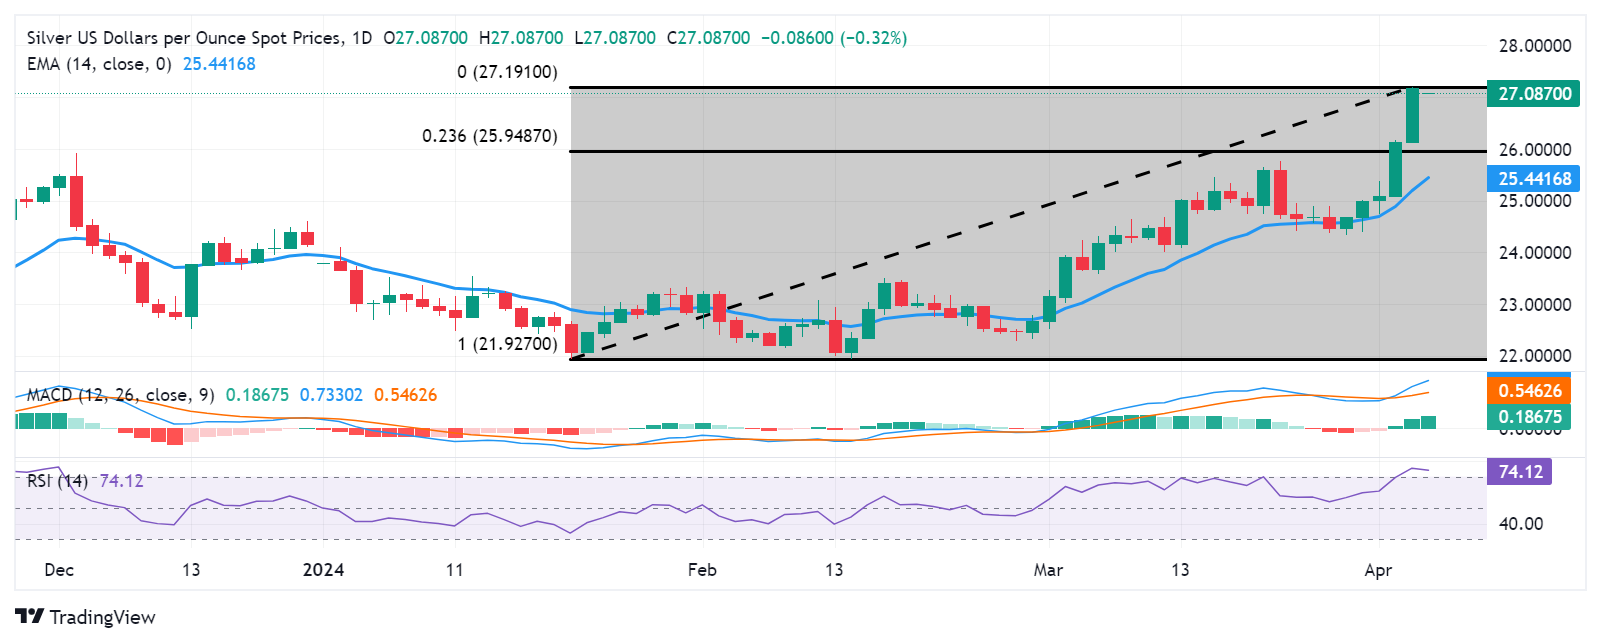
Silver price could find key support around the major level of $27.50, following the psychological level of $26.00, in conjunction with the 23.6% Fibonacci retracement level of $25.94. A break below this level could exert downward pressure on navigating the region around a major support level of $25.50 and the 14-exponential Moving Average (EMA) of $25.43.
Technical analysis suggests a bullish confirmation for the Gold price. The 14-day Relative Strength Index (RSI) is positioned above the 50 mark, indicating strength in buying momentum. Additionally, the Moving Average Convergence Divergence (MACD) shows a divergence above the signal line and remains above the centerline.
On the upside, the all-time high of $27.33 could act as an immediate resistance, followed by the major support at $27.50. A breakthrough above the latter could lead the Silver price to explore the region around the psychological level of $28.00.
XAG/USD: Daily Chart
-
03.04.2024 11:16Silver Price Forecast: XAG/USD falls slightly from two-year high at $26.30 ahead of Fed Powell’s speech
- Silver price drops slightly from fresh two-year of $26.30 ahead of key events.
- The near-term appeal is upbeat due to deepening geopolitical tensions.
- The US Dollar corrects ahead of Fed Powell speech.
Silver price (XAG/USD) faces nominal selling pressure after printing a fresh two-year high at $26.30 in the European session on Wednesday. The near-term demand for the white metal is upbeat due to deepening geopolitical tensions and a correction in the US Dollar.
Major agencies have accused Israel’s military for targeting charity staff who were advised to deliver necessities to civilians in Gaza. Non-yielding assets, such as Silver, expect higher investment in times of geopolitical uncertainty.
Meanwhile, a corrective move in the US Dollar has also boosted demand for silver. The US Dollar Index (DXY) drops to 104.73 despite upbeat United States Manufacturing PMI for March has improved the economic outlook.
In today’s session, investors will focus on the Federal Reserve (Fed) Chairman Jerome Powell’s speech, and the release of the ADP Employment Change and the Services PMI for March. Fed Powell’s speech could provide clues about when the central bank will start reducing interest rates. The ADP agency will report the number of jobseekers recruited by private employers.
Later this week, the release of the US Nonfarm Payrolls (NFP) data for March will be the major event. The official labor market data could influence market expectations for Fed rate cuts at the June meeting.
Silver technical analysis
Silver price prints a fresh two-year high at $25.30 after break above the crucial resistance of $26.22, plotted from 22 April 2022. The near-term demand is strong as the 20-week Exponential Moving Average (EMA) at $24.08 is sloping higher.
The 14-period Relative Strength Index (RSI) moves into the bullish range of 60.00-80.00, indicating that momentum towards the upside is strong.
-
02.04.2024 14:48Silver Price Forecast: XAG/USD rises to $25.80 as US Dollar slips after steady US Job Openings
- Silver price climbs above $25.50 as US Dollar’s rally stalls.
- Investors remain risk-averse as Fed rate cut expectations ease.
- Silver price aims to recapture annual highs of $26.14.
Silver price (XAG/USD) jumps to $25.80 after the United States Bureau of Labor Statistics (BLS) reported steady United States JOLTS Job Opening figures for February. US employers posted 8.756 million, against expectations of 8.74 million, and the former release of 8.748 million. This indicates that the labor demand is steady.
The market sentiment is downbeat as the S&P 500 has opened on a negative note. Easing Federal Reserve (Fed) rate cut expectations for the June meeting has turned investors risk-averse. 10-year US Treasury yields soar to 4.40%. The US Dollar Index (DXY) dips to 104.70 after refreshing a four-month high at 105.10.
The US Dollar struggles to maintain strength despite the upbeat US Manufacturing PMI for March, which has strengthened the US economic outlook further. The Institute of Supply Management (ISM) reported that the Manufacturing PMI landed above the 50.0 threshold for the first time after contracting for 15 straight months.
This week, investors will focus on the US Nonfarm Payrolls (NFP) data for March, which will be published on Friday. The labor market data will provide fresh cues about when the Federal Reserve (Fed) will start reducing interest rates.
Silver technical analysis
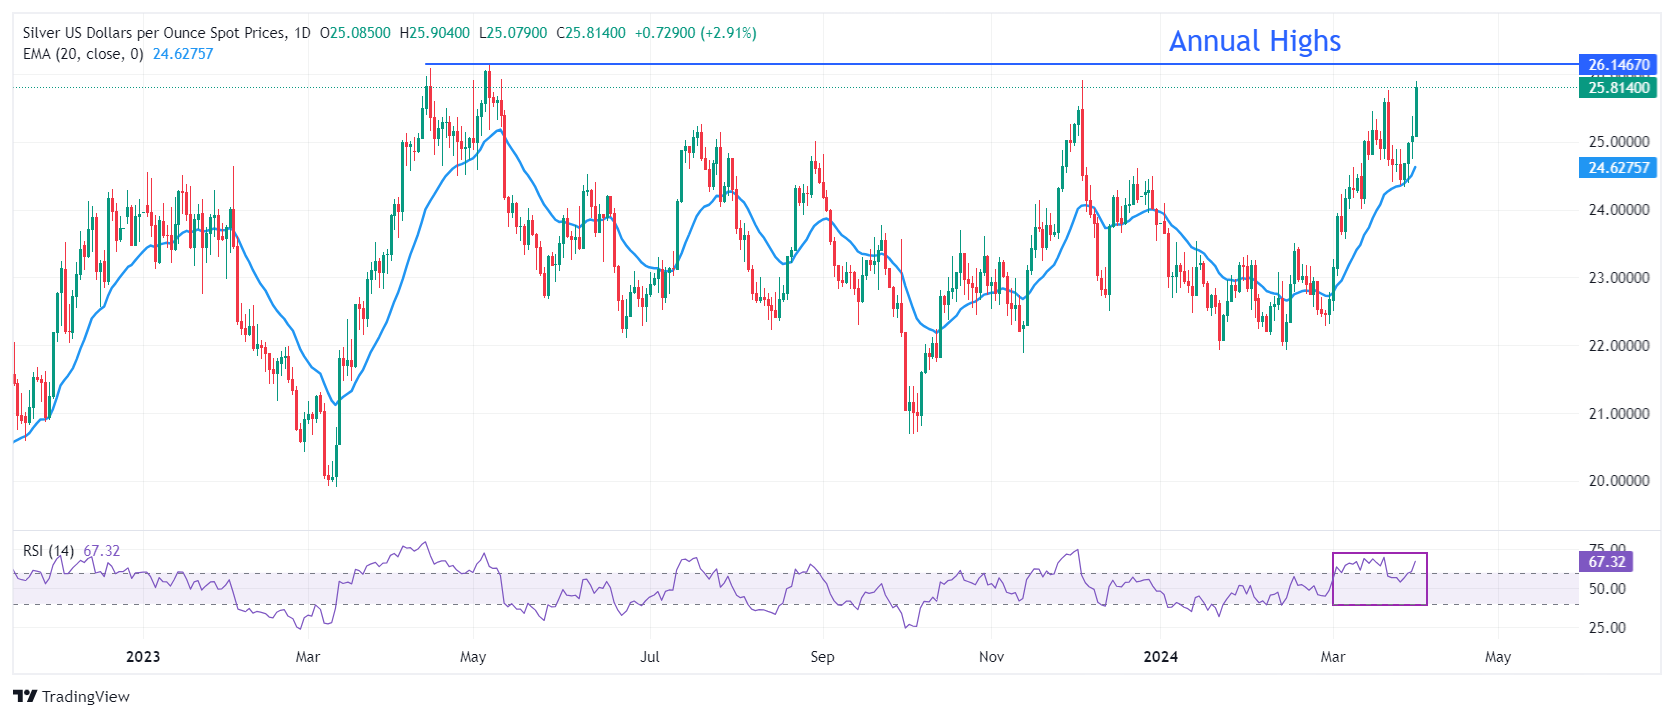
Silver price is inch away from testing annual highs at $26.14, formed on May 5. The near-term demand for the white metal is bullish as the 20-day Exponential Moving Average (EMA) at $24.63 is sloping higher.
The 14-period Relative Strength Index (RSI) oscillates in the 60.00-80.00 range, indicating that the bullish momentum is intact.
Silver daily chart
-
02.04.2024 08:55Silver Price Analysis: XAG/USD jumps back closer to YTD top, seems poised to climb further
- Silver scales higher for the fourth straight day and spikes to a one-and-half-week high.
- The technical setup favours bullish traders and supports prospects for additional gains.
- Any meaningful corrective decline is likely to find decent support near the $25.00 mark.
Silver (XAG/USD) gains positive traction for the fourth straight day on Tuesday and climbs further beyond mid-$25.00s during the first half of the European session, back closer to the YTD peak touched last week.
From a technical perspective, the recent bounce from the $24.35 resistance-turned-support zone and a subsequent strong move up favours bullish traders. Moreover, oscillators on the daily chart are holding in the positive territory and are still far from being in the overbought zone, suggesting that the path of least resistance for the XAG/USD is to the upside.
Hence, some follow-through strength towards testing the December 2023 swing high, just ahead of the $26.00 round figure, looks like a distinct possibility. Some follow-through buying would mark a fresh breakout and allow the XAG/USD to resume its recent strong upward trajectory witnessed since late February.
On the flip side, any meaningful corrective decline is more likely to attract fresh buyers near the $25.00 psychological mark. The next relevant support is pegged near the $24.65 region. A convincing break below the latter could drag the XAG/USD towards the aforementioned resistance-turned-support, around the $24.35 zone, which should act as a key pivotal point.
Some follow-through selling might shift the bias in favour of bearish traders and make the XAG/USD vulnerable to accelerate the decline further towards the $24.15-$24.10 region. The white metal could eventually weaken below the $24.00 round-figure mark, towards the 50-day Simple Moving Average (SMA), currently pegged near the $23.60 zone.
Silver daily chart


© 2000-2024. All rights reserved.
This site is managed by Teletrade D.J. LLC 2351 LLC 2022 (Euro House, Richmond Hill Road, Kingstown, VC0100, St. Vincent and the Grenadines).
The information on this website is for informational purposes only and does not constitute any investment advice.
The company does not serve or provide services to customers who are residents of the US, Canada, Iran, The Democratic People's Republic of Korea, Yemen and FATF blacklisted countries.
Making transactions on financial markets with marginal financial instruments opens up wide possibilities and allows investors who are willing to take risks to earn high profits, carrying a potentially high risk of losses at the same time. Therefore you should responsibly approach the issue of choosing the appropriate investment strategy, taking the available resources into account, before starting trading.
Use of the information: full or partial use of materials from this website must always be referenced to TeleTrade as the source of information. Use of the materials on the Internet must be accompanied by a hyperlink to teletrade.org. Automatic import of materials and information from this website is prohibited.
Please contact our PR department if you have any questions or need assistance at pr@teletrade.global.
transfers