- Analytics
- News and Tools
- Quotes
- Chart and quotes for AUDUSD
CFD Trading Rate Australian Dollar vs US Dollar (AUDUSD)
| Date | Rate | Change |
|---|
Related news
-
23.04.2024 22:33AUD/USD rises to two-day high ahead of Aussie CPI
- AUD/USD extends gains, influenced by disappointing S&P Global PMIs from the US, suggesting possible Fed easing.
- US Dollar weakens as Treasury yields fall and equity markets respond positively to the potential shift in Fed policy.
- Upcoming Australian CPI data could influence the Reserve Bank of Australia's policy stance.
The Aussie Dollar recorded back-to-back positive days against the US Dollar and climbed more than 0.59% on Tuesday, as the US April S&P PMIs were weaker than expected. That spurred speculations that the Federal Reserve could put rate cuts back on the table, following last week's hawkish rhetoric. The AUD/USD trades at 0.6488, up by 0.01% as Wednesday’s Asian session begins.
Aussie Dollar capitalizes softer US PMIs amid increasing Fed rate cut hopes
S&P Global revealed that manufacturing activity in the US contracted slightly to 49.9, down from 51.9 in March. The Services and Composite PMIs cling to expansionary territory, but both fell from 51.7 to 50.9 and from 52.1 to 50.9.
Following the data, US equities rose, US Treasury yields fell, and the Greenback posted losses. The US Dollar Index (DXY), which tracks the buck’s performance against the six other currencies, dropped 0.44% and stayed at 105.68.
The AUD/USD rose from daily lows around 0.6440s toward the day’s high at 0.6490.
Other data shows that New Home Sales surged to a six-month high, indicating robust demand in the housing market. However, Building Permits continued to show contraction, albeit with a slight improvement, as the initial decline of -4.3% was revised to -3.7%.
On the Aussie’s front, the Consumer Price Index (CPI) for the first quarter is expected to edge lower, from 4.1% to 3.4% YoY. On a quarterly basis, it is expected to tick higher from 0.6% to 0.8%, while monthly figures are foreseen to remain unchanged at 3.4%.
ANZ analysts commented that the Reserve Bank of Australia wouldn’t likely change their stance, noting, “Looking ahead to the next RBA Board decision on 7 May, we don’t think slightly higher inflation than the RBA is expecting will prompt a shift back to an overt tightening bias.”
AUD/USD Price Analysis: Technical outlook
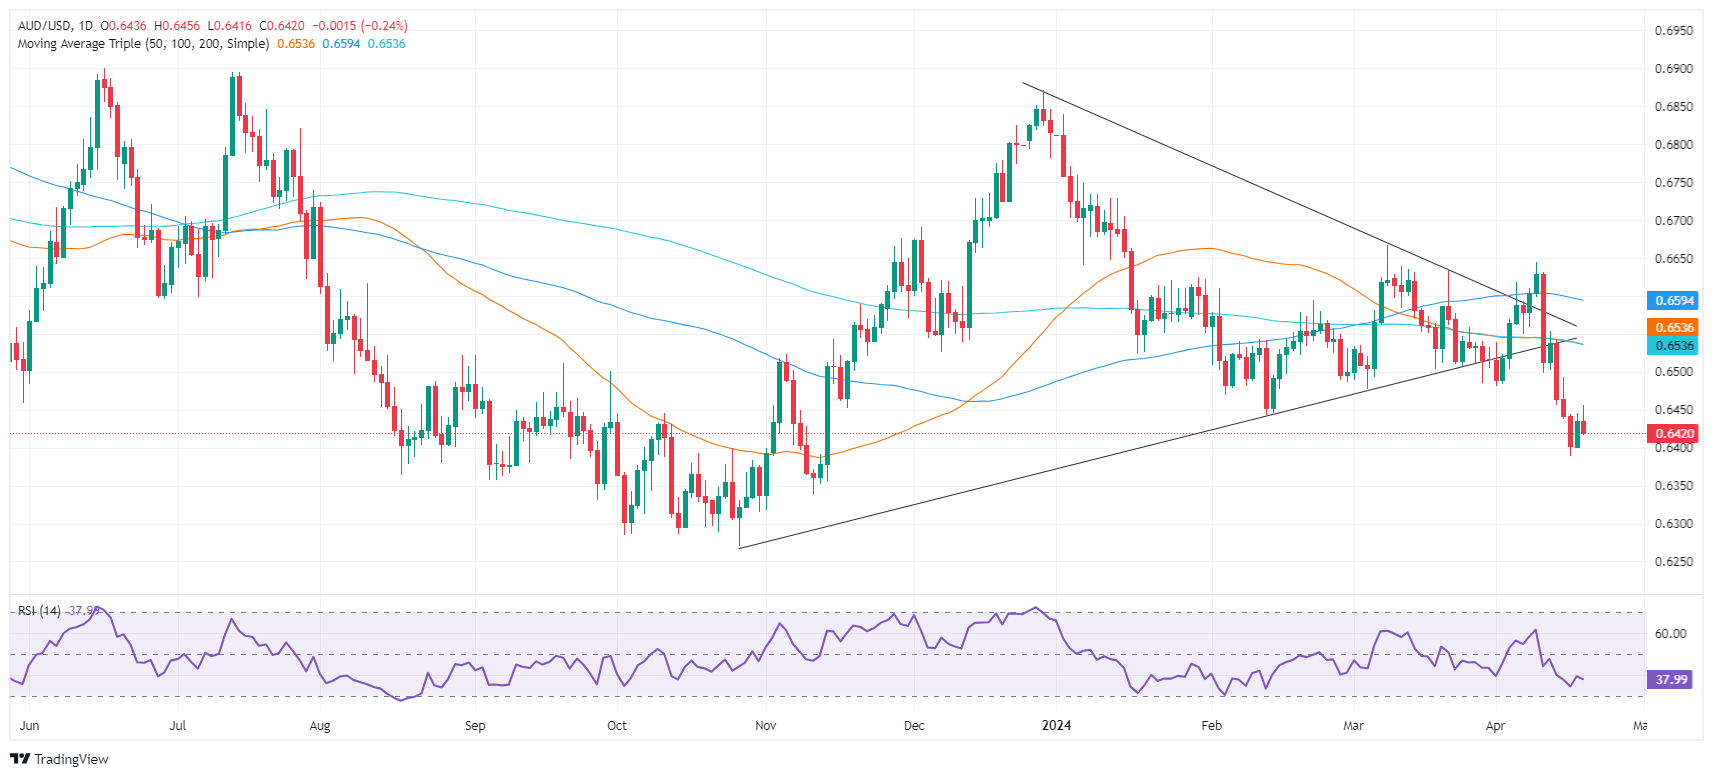
From a technical perspective, the AUD/USD turned bullish in the short term, following the formation of a ‘morning star’ chart pattern, but downside risks look. Buyers need to clear the 0.6500 hurdle and surpass the confluence of the 50 and 200-day moving averages (DMAs) at 0.6527/32, which formed a ‘death cross.’ If cleared, that would extend the rally to 0.6600. On the other hand, a reversal and a daily close below 0.6440, could pave the way to re-test year-to-date (YTD) lows of 0.6362.
-
23.04.2024 12:57AUD/USD Price Analysis: Despite signs this is probably not a bullish reversal
- AUD/USD is showing technical bullish reversal signs.
- The question is, are they enough to indicate a chance of a reversal of the trend?
- Daily, 4-hour and Weekly charts are analyzed to weigh up the evidence.
“The trend is your friend,” traders like to say, and AUD/USD is in a downtrend overall.
At the same time it is showing some early technical signs – here and there – that point to a possible bullish reversal.
What are these signs and are they enough to suggest a reversal of the trend and the birth of a new bull trend in AUD/USD?
Early bullish clues?
The bullish signs are particularly clear on the short and intermediate term charts – or the 4-hour and daily timeframes.
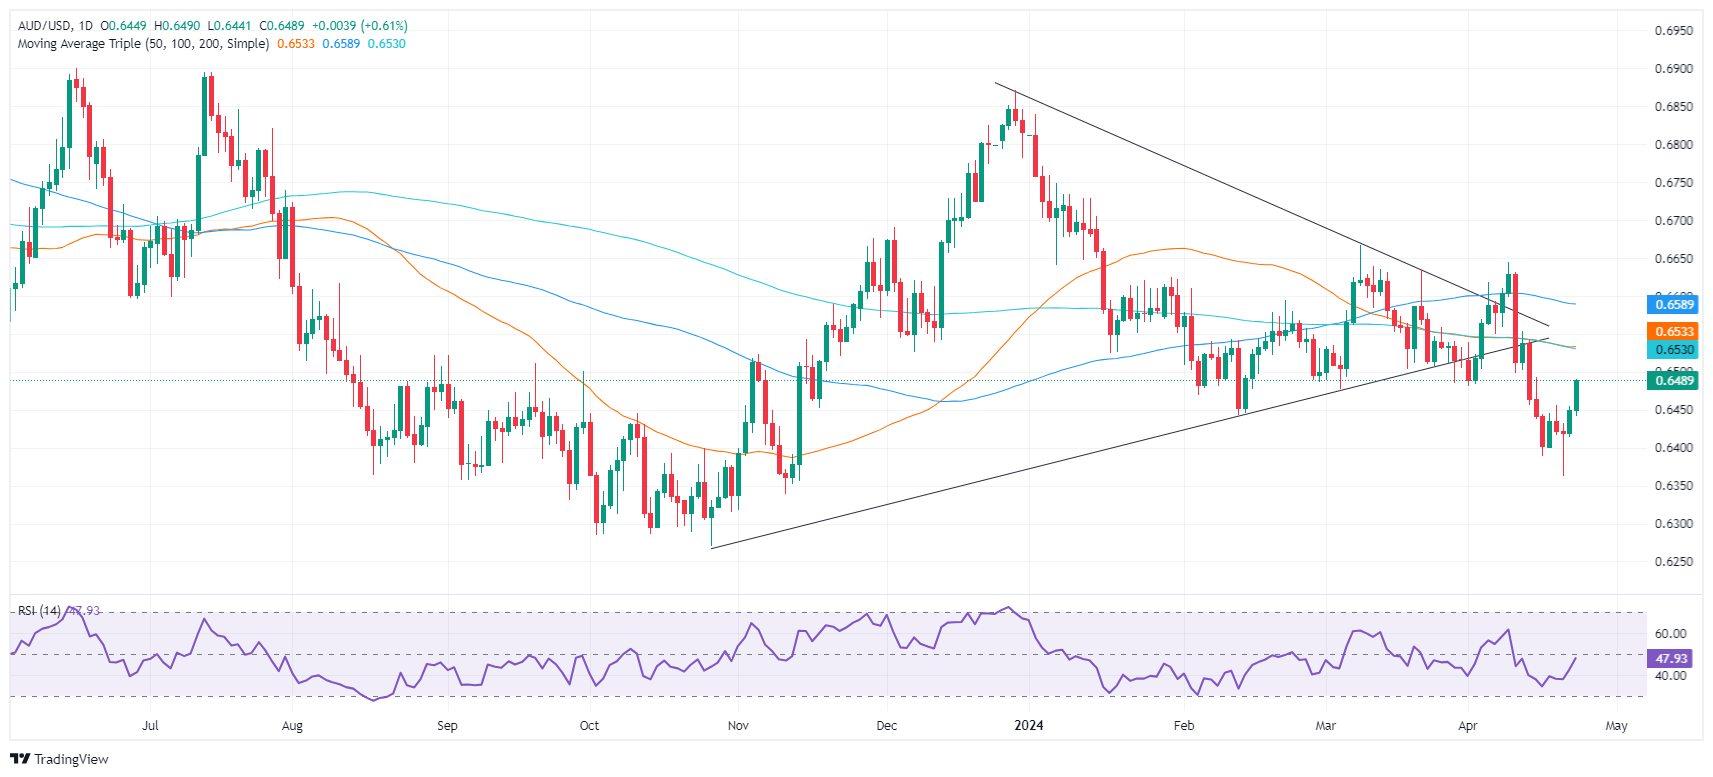
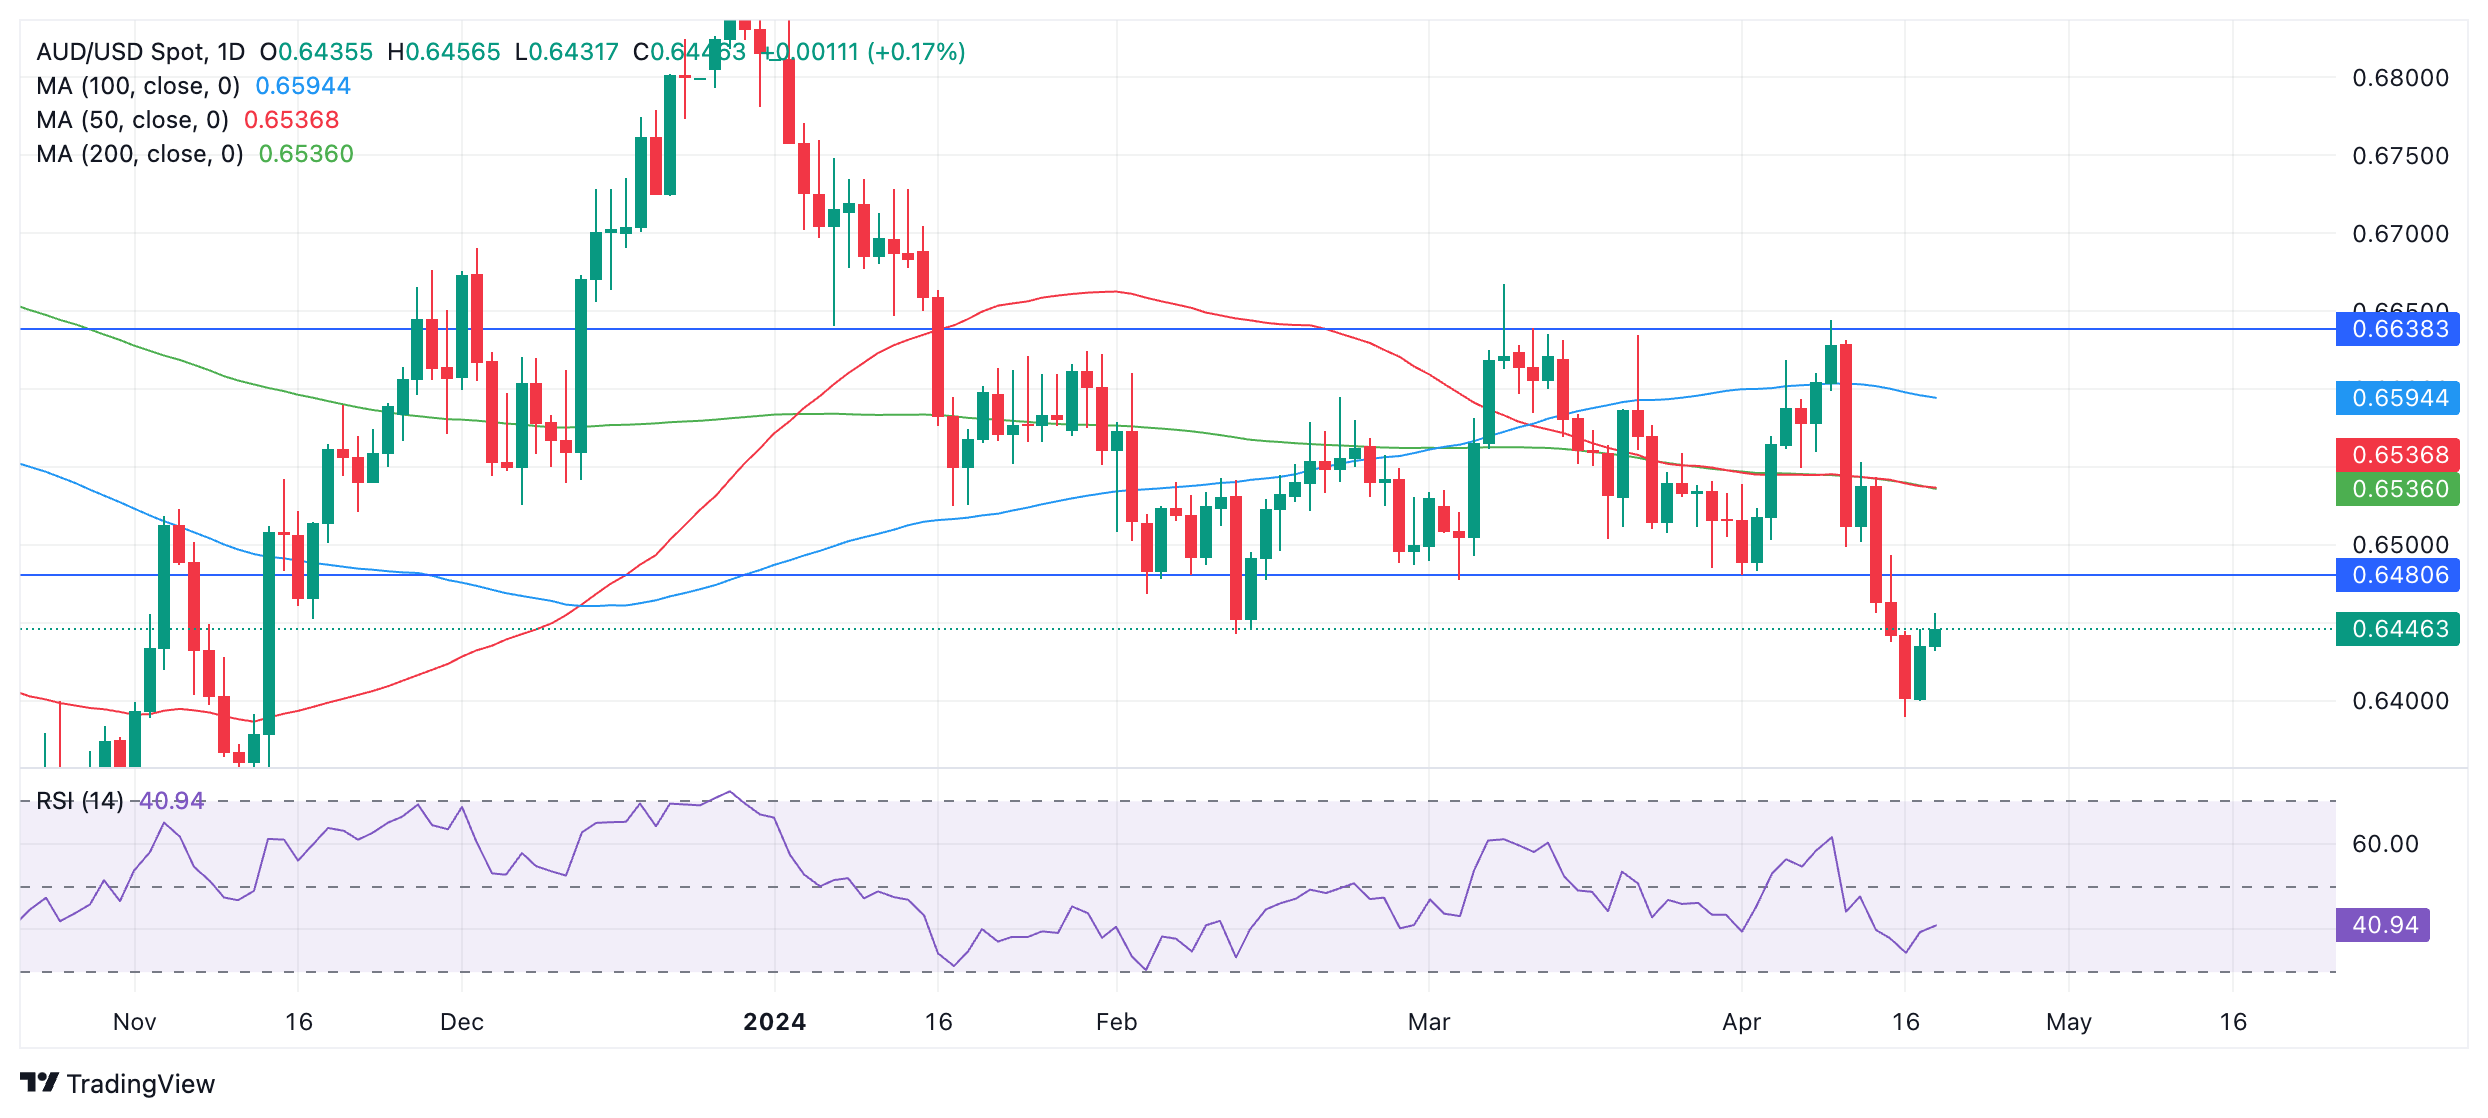
The AUD/USD daily chart below, used to analyze the intermediate-term trend, is showing a bullish Dragonfly Doji candlestick reversal pattern (circled) at the recent Friday April 19 lows. This was followed by a green up day on Monday, which provides added bullish confirmation.
The inference from these candlesticks is that AUD/USD is undergoing a reversal, albeit one of short duration.
AUD/USD Daily Chart
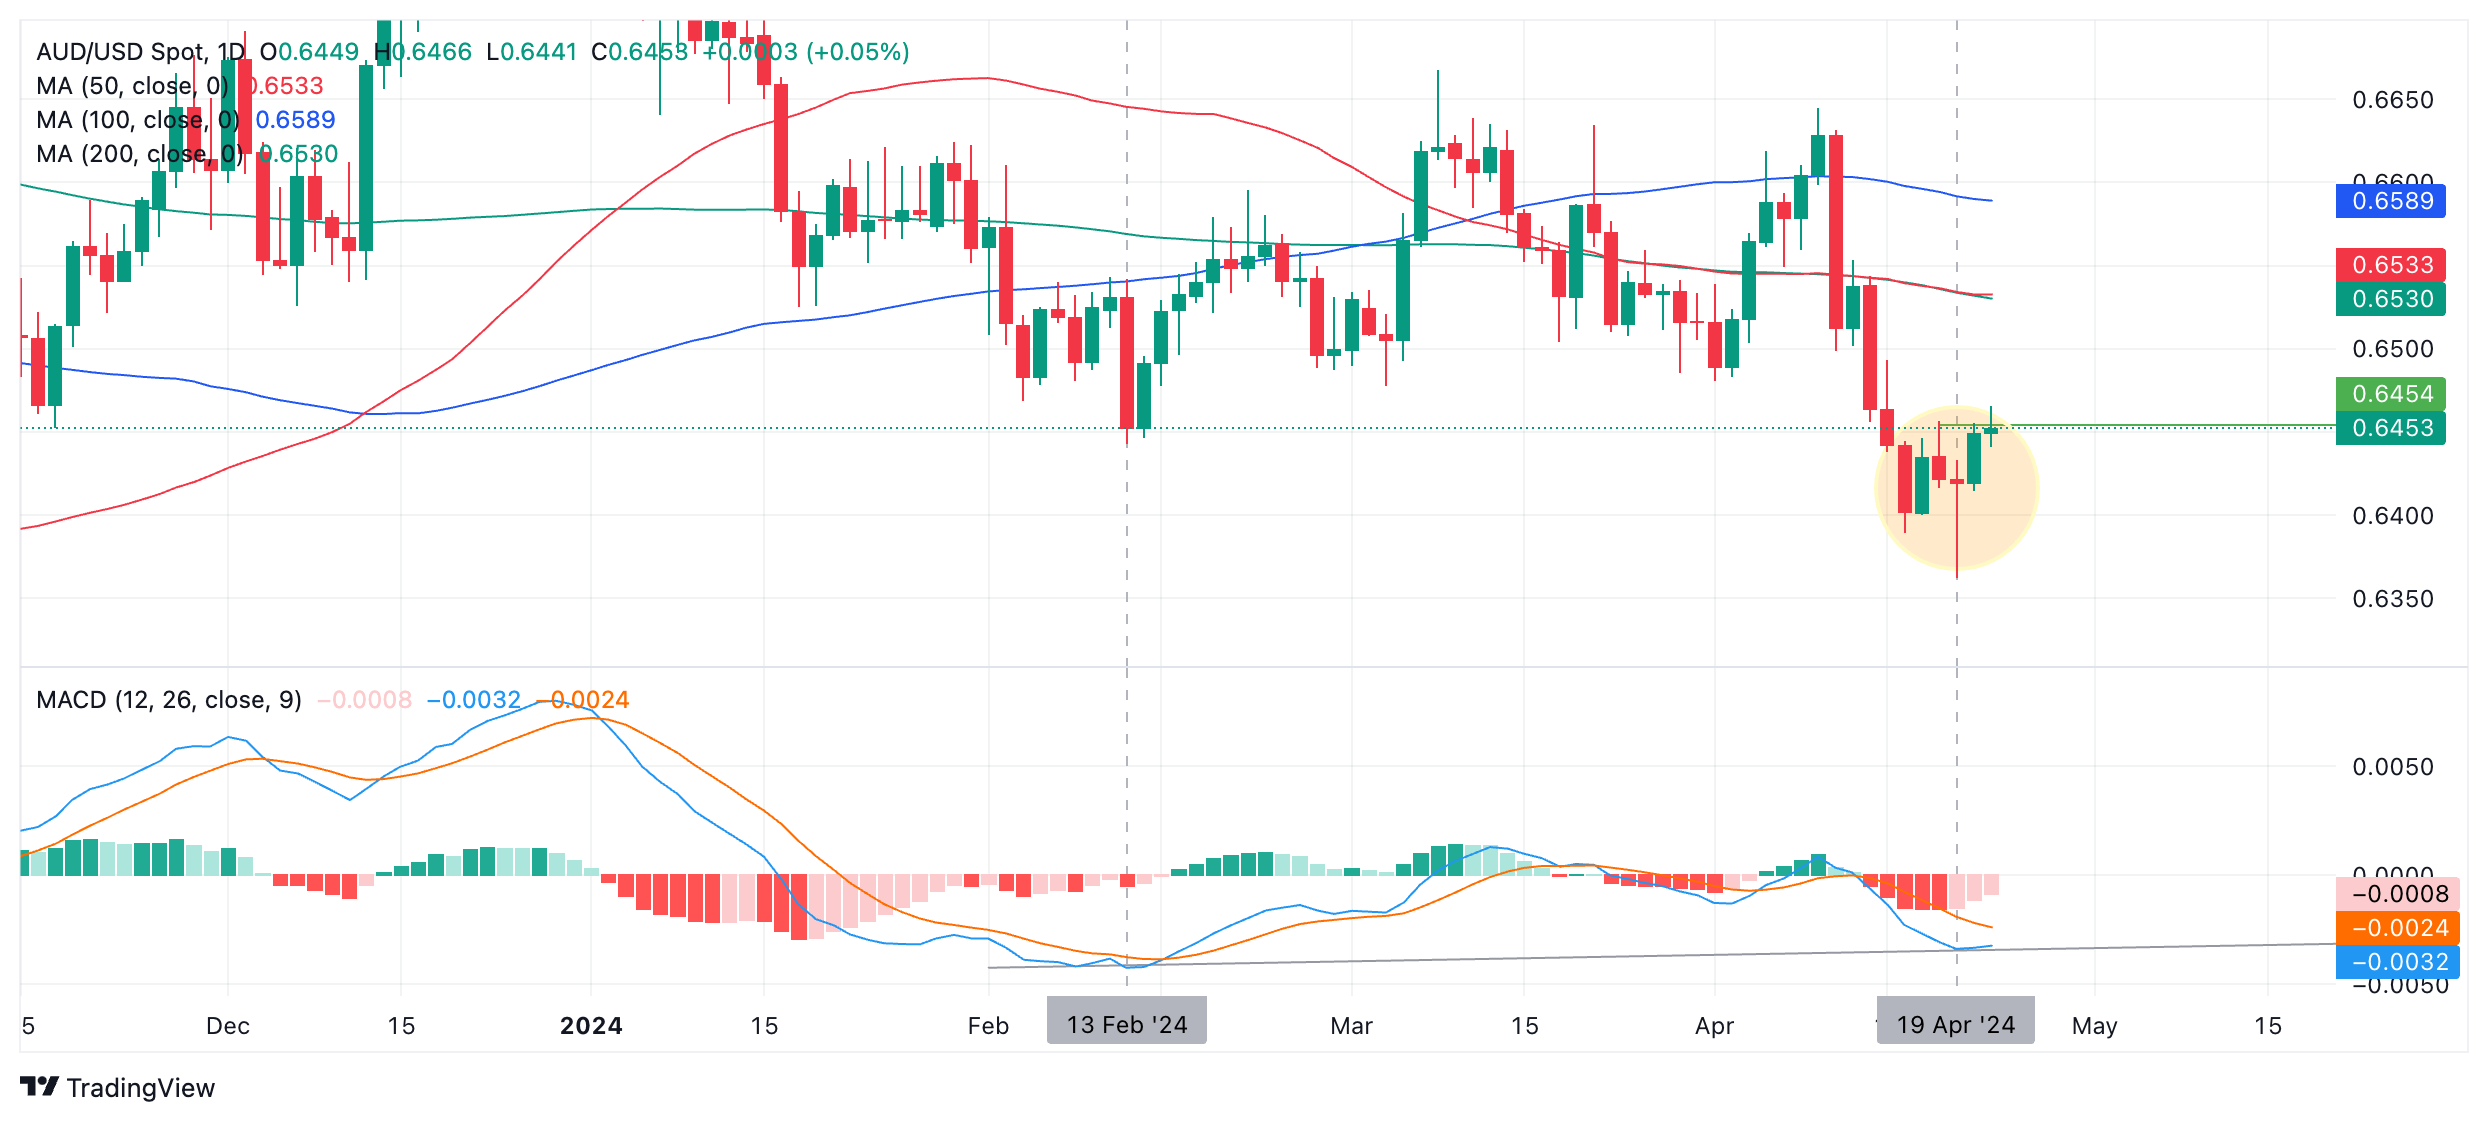
Also on the daily chart, the Moving Average Convergence/Divergence is converging slightly with price when comparing the February 13 low with the April 19 low. Although price is drastically lower in April, the MACD is actually slightly higher when compared to the MACD in February, suggesting a lack of bearish momentum underpins the most recent sell-off. This is sometimes an early warning sign a bear trend is ending.
Bearish counter-arguments
There are no other signs the intermediate trend is reversing. Price is still under the three major moving averages – the 50-day, 100-day and 200-day Simple Moving Averages (SMA), which is a bearish sign.
Nor has it broken above the April 11 high at 0.6563, the last lower high of the downtrend on the daily chart, a further requirement to be confident the trend was reversing.
Additionally, although the sell-off in April lacks momentum it is very steep, and this steepness probably indicates more downside before the downtrend ends.
Analyzing the short-term trend
AUD/USD’s 4-hour chart which is used to assess the short-term trend, is also showing some bullish reversal insignia, though still nothing definitive.
AUD/USD 4-hour Chart
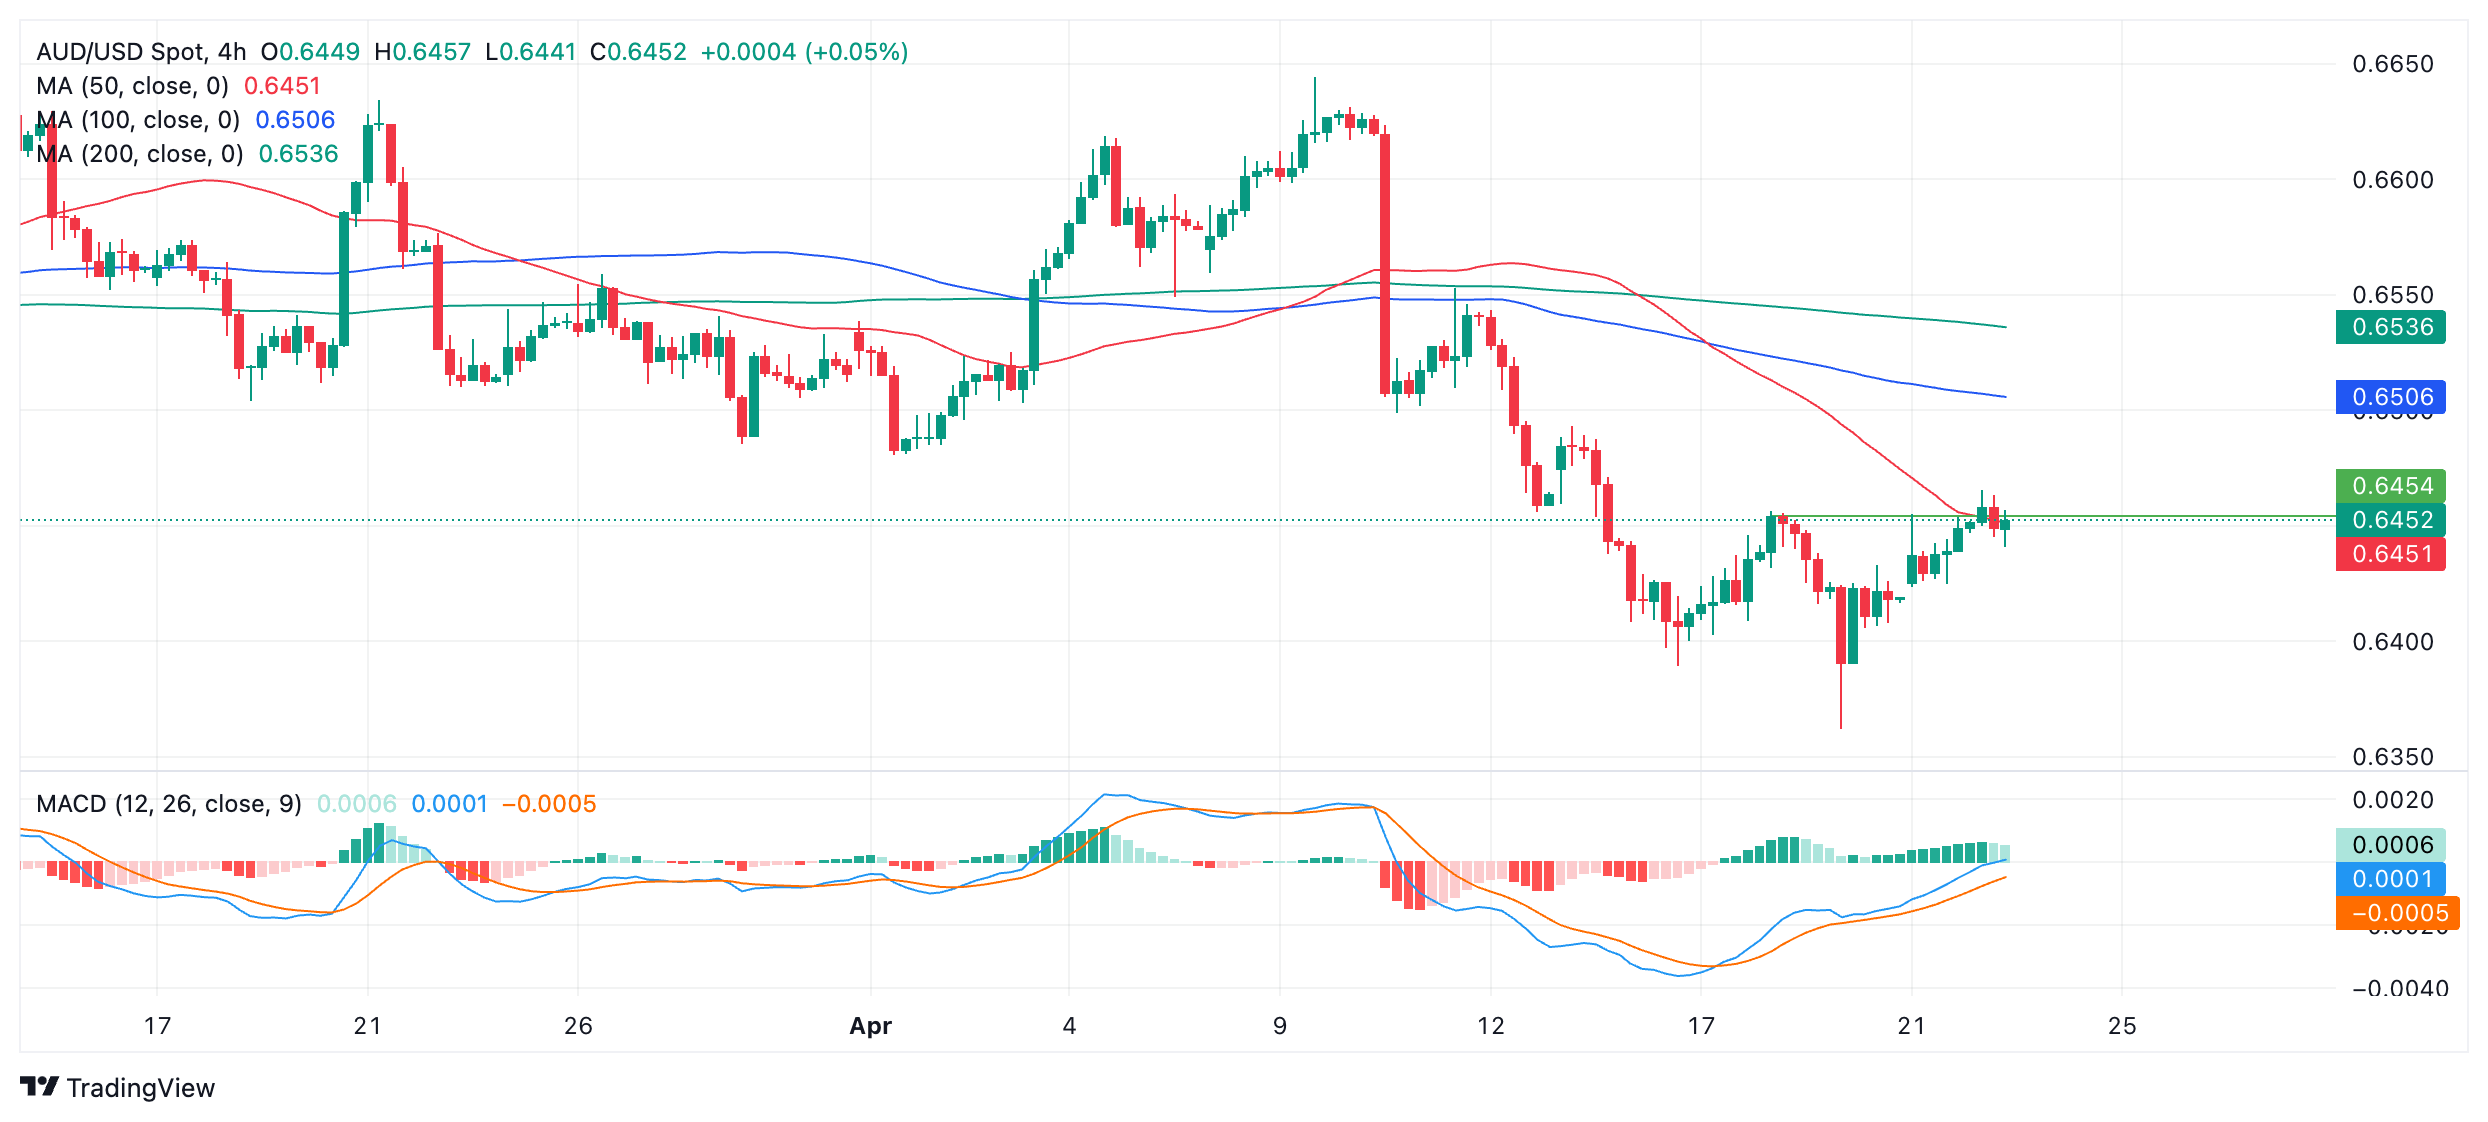
The pair has risen above the last lower high of the downtrend at 0.6452 and has broken above the 50-4hr SMA. These are both quite bullish signs.
In addition, the accompanying MACD, during the recovery from the April 19 lows, has been strongly bullish, rising more quickly than it fell over a similar timespan. This shows bullish enthusiasm and potentially institutional buyers could be participating.
MACD has also crept above the zero line on Tuesday, adding more bullish evidence to the argument.
AUD/USD Weekly Chart
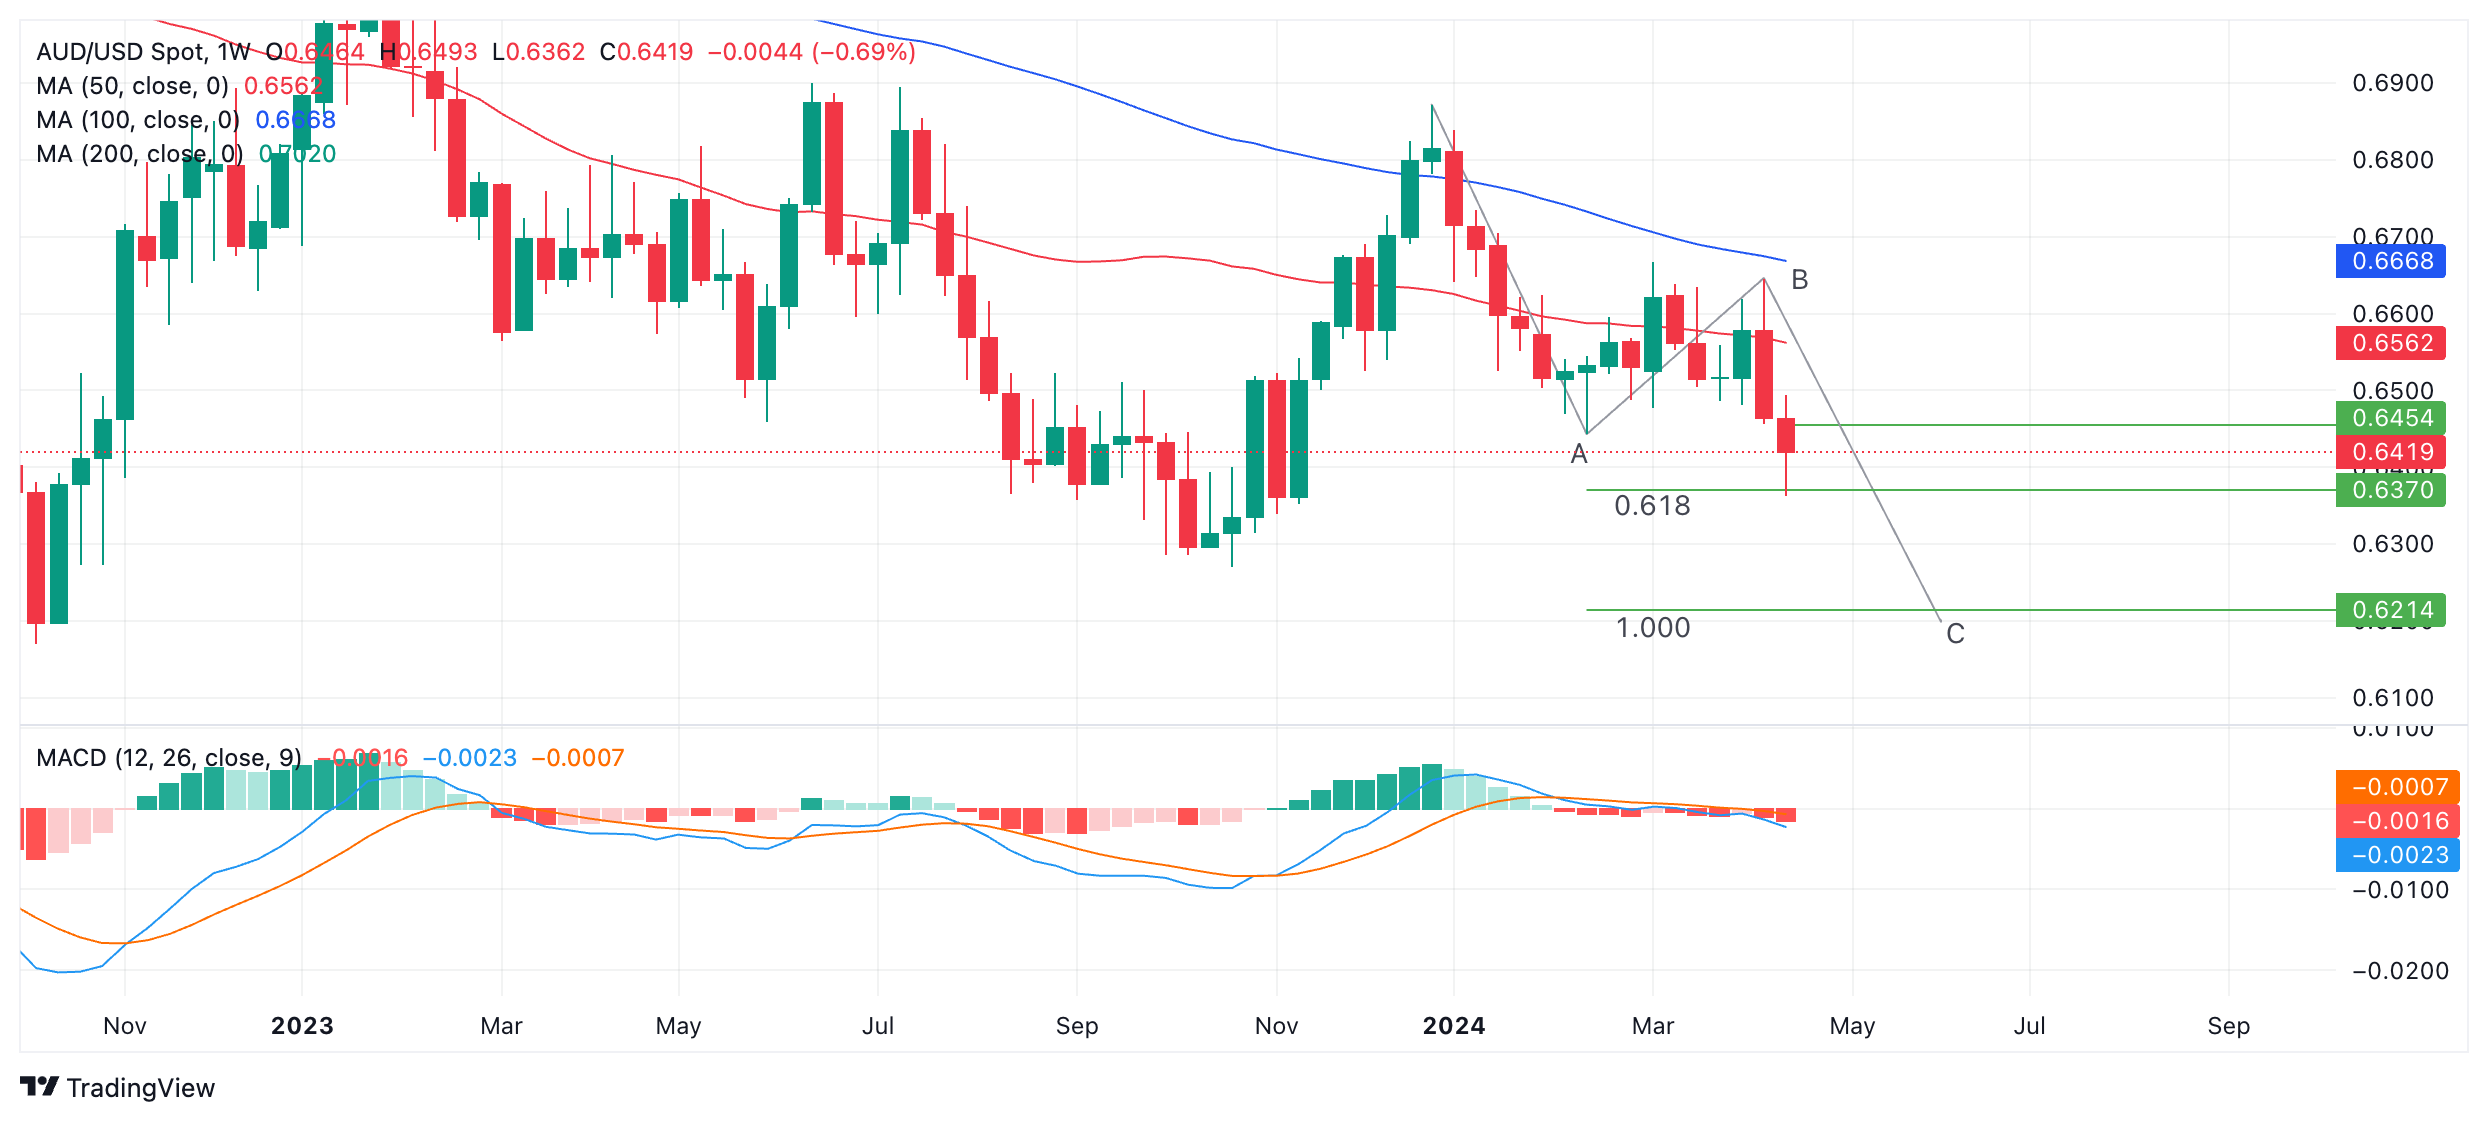
Finally we look at the weekly chart to assess the long-term trend. This is the least-bullish looking chart of the three.
AUD/USD looks like it has probably formed a bearish three-wave Measured Move pattern, with waves A, B and C shown labeled. If so, the pair looks to be in the middle of unfolding its C-wave. Once C is complete, price is likely to undergo a reversal or, at least, a correction.
Wave C is normally equal to the length of wave A or more conservatively a Fibonacci 0.618 ratio of A. If the latter is the case, wave C may have already completed. This would add weight to the bullish reversal thesis.
If not, wave C probably has further to fall. Going by the patterning on the chart this looks more likely to be the case and continues to tip the balance in favor of the bearish case overall.
-
22.04.2024 23:28AUD/USD rises on risk-on mood, upbeat PMIs
- AUD/USD climbs over 0.54%, reaching 0.6449, buoyed by gains in Wall Street and a flat US Dollar.
- Australian manufacturing activity nears expansion with April's Judo Bank Manufacturing PMI rising to 49.9.
- Busy week ahead for US economic data, including PMIs and GDP, expected to influence AUD/USD direction.
The Aussie Dollar began the week on the front foot and registered gains against the US Dollar on Monday, gaining more than 0.54% as risk appetite improved. As the Asian session begins, the AUD/USD trades at 0.6449, up 0.01%.
AUD/USD nears 0.6450 boosted by positive Australian data and lower US Treasury yields
Wall Street finished the session with gains, while US Treasury yields edged lower. The Greenback finished the session flat, though the AUD/USD bounced off yearly lows, shy of the 0.6450 area.
Data from Australia revealed that manufacturing activity in April improved. The Judo Bank Manufacturing PMI came at 49.9, up from 47.3, at a tick of expansion. The Services PMI cooled from 54.4 to 54.2, though it expanded at the fastest rate in two years.
In the meantime, data from the United States featured the Chicago Fed National Activity Index (CFNAI), which rose by 0.15 in March from 0.09 in February. The index’s three-month moving average increased from -0.28 in February to -0.19 in March.
What’s ahead for AUD/USD traders?
This week, the economic docket in the United States (US) will be busy. It will feature S&P Global PMIs, housing data, Durable Goods Orders, and the GDP for the first quarter of 2024. That, along with the release of the Fed’s preferred gauge for inflation, the March Personal Consumption Expenditure (PCE) Price Index, will dictate the direction of the AUD/USD.
-
22.04.2024 14:24AUD/USD trading higher despite USD strength as commodities hold value
- AUD/USD trades marginally higher versus the USD on easing Middle East tensions.
- Higher commodity prices, especially amongst metals of which Australia exports are also supportive.
- Aussie CPI data for Q1 and US PCE inflation data are likely to be the main movers in the week ahead.
AUD/USD is trading higher in the 0.6430s at the start of the week as Middle East tensions ease and commodities hold their value.
The Australian Dollar (AUD) tends to decline during periods of uncertainty, unlike the US Dollar (USD) which has safe-haven qualities, so the unwinding of geopolitical risk helps AUD more than USD.
Israel’s counter-attack against Iran led to a sudden spike in the fear index on Friday and a resulting new low for April in AUD/USD at 0.6362. The Israelis fired a warning shot at a nuclear facility near Isfahan. The strike could have set off a thermonuclear explosion but in the end didn’t, and Iran has not retaliated. As a result, markets have settled back down on Monday, leading to renewed upside for the Aussie.
US Dollar stronger in most pairs
The US Dollar remains strong in most pairs despite the fall in safe-haven flows. This is due to the fact that markets expect data out of the United States this week to show continued economic growth.
“The US preliminary April PMIs (Tuesday), Q1 GDP (Thursday) and March Personal Income and Outlays report (Friday) are expected to back American economic exceptionalism,” says Brown Brothers Herriman in a note on Monday, adding, “Overall, as long as US economic activity remains solid, the cyclical USD uptrend is intact.”
The most important release will be Friday’s US Personal Consumption Expenditure (PCE) data for March, including the Federal Reserve’s (Fed) preferred gauge of inflation, the Personal Consumption Expenditure – Price Index.
If PCE inflation in the United States (US) registers a higher-than-expected rise it will boost USD/JPY, by suggesting an even longer delay before the Fed reduces interest rates. If interest rates remain higher for longer it increases demand for USD from foreign investors looking to park their capital.
Australian exceptionalism
AUD/USD is fairing better than most USD pairs partly because commodities, which Australia is a major exporter of, are holding their value better than expected.
“The ongoing squeeze in global commodity prices are helping shield the Aussie somewhat on crosses. The LME’s base metals index rose 5.3% last week taking its gains so far in April to 14%,” says Richard Franulovich, Head of FX Strategy, at Westpac.
The supportive effect may not last, however, since Iron Ore, which is Australia’s largest export, could be peaking and about to roll over.
“Iron ore markets showed some signs of peaking after the sharp ru up through April. The May SGX contract is up $1.15 from the same time Friday at $115.90 while the 62% Mysteel index is down 35c at $116.90,” says Westpac.
Chile has increased tariffs on Chinese steel and in the US President Biden is calling for higher tariffs to prevent Chinese steel from flooding the market and pricing out the competition. Australia is a major supplier of Iron Ore to China for its steel production so a trade war or higher tariffs could hit Australian exports, and the Aussie Dollar.
“In a sign that close to record Chinese steel exports is pressuring steel producers around the world, Chile slapped anti-dumping tariffs on Chinese steel products with a 33.5% import tax on steel balls and 24.9% on steel bars. The move follows US President Biden last week calling on the USTR to triple the tariff on Chinese steel,” adds Westpac.
Australia to publish Inflation data
The major release for AUD in the week ahead is Australian Consumer price Index (CPI) data for the first quarter of 2024, out on Wednesday, April 24.
Analysts expect Q1 CPI to rise 0.8%, compared to 0.6% in Q4, though base effects will see the annual pace easing to 3.4%, from 4.1%.
“Westpac’s forecast for the trimmed mean is 0.8% for the quarter, taking the annual pace from 4.2% YoY to 3.8% YoY, the slowest since March 2022, says Richard Franulovich.
The Reserve Bank of Australia (RBA) is not expected to cut rates before the Federal Reserve (Fed) which is another supportive factor for the AUD/USD. Relatively higher interest rates support currencies since they encourage more capital inflows. Whilst the RBA has set base interest rates at 4.35% against the Fed’s 5.25%-5.50%, favoring the US Dollar overall, whether or not the differential widens or closes is a key factor for AUD/USD’s valuation.
Current market expectations are for the RBA to cut interest rates in December after the Fed cuts in September/November, according to Westpac’s Franulovich. This is supporting AUD/USD since the differential is expected to narrow.
However, Wednesday’s Aussie CPI data could be key in this regard since, “A softer than consensus Q1 CPI could galvanize the potential for RBA rate cuts before the Fed,” says the Westpac analyst, which would translate into further downside for the AUD/USD.
-
21.04.2024 23:18AUD/USD remains on the defensive below 0.6450, investors await Australian CPI data
- AUD/USD holds below 0.6450 in Monday’s early Asian session.
- The hawkish comments from Fed officials in recent weeks have lifted the Greenback.
- The moderate Australian inflation data and the continuously tight labour market could prompt RBA rate cuts this year.
The AUD/USD pair remains on the defensive near 0.6420 during the early Asian session on Monday. The Federal Reserve (Fed) media blackout went into effect at midnight Friday. Nonetheless, the US central bank has delivered hawkish messages in recent weeks and markets expect the first cut in September.
On Friday, Chicago Fed President Austan Goolsbee said that inflation progress had “stalled and the Fed’s current restrictive policy is appropriate. Meanwhile, Atlanta Fed President Raphael Bostic, one of the most hawkish members of the FOMC, stated that the US central bank wouldn’t cut rates until the end of the year. The chance of a June cut has fallen below 20% and the odds of a July cut have dropped below 50%. A September cut is not fully priced in, with the probability falling below 90%, according to the CME FedWatch Tool.
The hawkish stance from Fed officials in recent weeks provides some support to the US Dollar (USD) and creates a headwind for the AUD/USD pair. Investors will take more cues from the US inflation data this week. The final reading of the US March Personal Consumption Expenditures Price Index (PCE) will be due on Friday. Headline PCE inflation is estimated to rise to 2.6% YoY, while the core is expected to fall a tick to 2.7% YoY.
On the Aussie front, inflation is still above the Reserve Bank of Australia’s (RBA) target but continues to moderate in line with the RBA’s latest forecasts. The continuously tight labor market could prompt those calling for an RBA rate reduction before the end of the year, which might drag the Australian Dollar (AUD) lower against the Greenback. The Australian Consumer Price Index (CPI) on Wednesday will be a closely watched event. Investors may push back the expected timing of rate cuts if the inflation data is hotter than expected, which might cap the downside of the AUD/USD pair. -
19.04.2024 14:20AUD/USD holds recovery above 0.6400 as US Dollar dips
- AUD/USD clings to gains above 0.6400 as market sentiment improves.
- The appeal for risky assets improved after reports from Iran indicated that the attack in Isfahan was exaggerated.
- Weak Australian Employment data positively influence speculation for early RBA rate cuts.
The AUD/USD pair holds gains above the round-level support of 0.6400 in Friday’s early New York session. The Aussie asset recovers as fears of further escalation in Middle East tensions ease after Iran reported that the drone attack did not harm nuclear facilities in Isfahan. Also, the attack from Israel, which has not been confirmed by them but by US officials appeared to be limited in size. Meanwhile, Iran said that they have no plans for an immediate retaliation.
Market sentiment turns upbeat as the appeal for risky assets improves. The S&P 500 witnesses buying interest at open and recovers losses posted in the European session. 10-year US Treasury yields fall to 4.62% even though Federal Reserve (Fed) policymakers have been endorsing higher interest rates for a longer period.
Fed policymakers have been arguing that they are comfortable with higher interest rates because labor demand is robust and wages are rising. They have warned that the progress in inflation declining to the 2% target is lower than expected.
The US Dollar Index (DXY) whipsaws around 106.00 as the appeal for risk-perceived assets improves. The near-term outlook of the US Dollar is still strong due to upbeat United States economic prospects.
Meanwhile, weak Australian Employment data for March has strengthened speculation for early rate cuts by the Reserve Bank of Australia (RBA). According to the Australian Bureau of Statistics, employers fired 6.6K workers against expectations of fresh 7.2K hiring. In February, 117.6K job-seekers were hired, which was slightly revised higher from 116.5K. The Unemployment Rate rose to 3.8% from 3.7% but remained below the estimates of 3.9%.
-
18.04.2024 23:20AUD/USD pressured as Fed officials hold firm on rate policy
- AUD/USD falls following hawkish signals from Fed officials, emphasizing no immediate rate cuts.
- US economic indicators strengthen, with the Philadelphia Fed Manufacturing Index hitting a new high since April 2022.
- Australian employment data disappoints, with job losses and a slight increase in the unemployment rate casting shadows over RBA forecasts.
The Aussie Dollar is on the defensive against the US Dollar, as Friday’s Asian session commences. On Thursday, the antipodean clocked losses of 0.21% against its counterpart, driven by Fed officials emphasizing they’re in no rush to ease policy. The AUD/USD trades at 0.6419 at the time of writing.
AUD/USD slumped on Fed officials’ comments
A reflection of that was Wall Street’s finishing in the red. On Thursday, Atlanta’s Fed President Raphael Bostic was hawkish, questioning that they could not be able to cut rates towards the end of the year. His colleague, John Williams from the New York Fed, said that the current policy is in a good place and that patience is required before lowering rates. Although he doesn’t consider hiking rates as his base scenario, he added the Fed would raise them if needed.
US data revealed that manufacturing activity is gaining steam. The Philadelphia Fed Manufacturing Index experienced a significant increase, jumping to 15.5, far surpassing the modest expectation of 1.5, its highest level since April 2022. In the jobs market, Initial Jobless Claims for the last week were unchanged at 212K, while Continuing Claims edged up to 1.812 million, below estimates.
Given the solid fundamental backdrop, traders had priced in two rate cuts by the Fed for 2024. Data from the Chicago Board of Trade (CBOT) shows investors project the Federal funds rate (FFR) to end at 5.07%.
On the Aussie front, jobs data declined by 6.6K in March, missing estimates, while the unemployment rate edged up from 3.7% to 3.8%. According to ANZ Analysts, “the labour market may be running slightly hotter than the RBA forecast at the time of its February Statement on Monetary Policy. The RBA was forecasting employment growth to slow to 2.0% y/y and the unemployment rate to reach 4.2% by the end of the June quarter this year.”
AUD/USD Price Analysis: Technical outlook
The AUD/USD has shifted bearishly after the exchange rate fell below the latest cycle low of 0.6442 on February 13, the previous year-to-date (YTD) low. Hence, a continuation is expected, but sellers must surpass the 0.6400 mark. A breach of the latter will expose the November 10, 2023, daily low of 0.6338 an intermediate support level, followed by a major cycle low printed on October 26, 2023, at 0.6270. On the other hand, buyers need to push prices toward the 0.6500 figure, if they would like to remain hopeful of higher prices.
-
18.04.2024 12:43AUD/USD ticks higher as RBA also expected to delay cutting interest rates
- AUD/USD recovers marginally after the recent steep sell-off.
- Both the Fed and RBA are expected to delay cutting interest rates now.
- This means the interest rate differential, a key driver of FX, is unlikely to widen as much as in other pairs.
AUD/USD climbs about a tenth of a percent into the 0.6440s on Thursday, continuing the correction of the steep sell-off in the pair at the start of April.
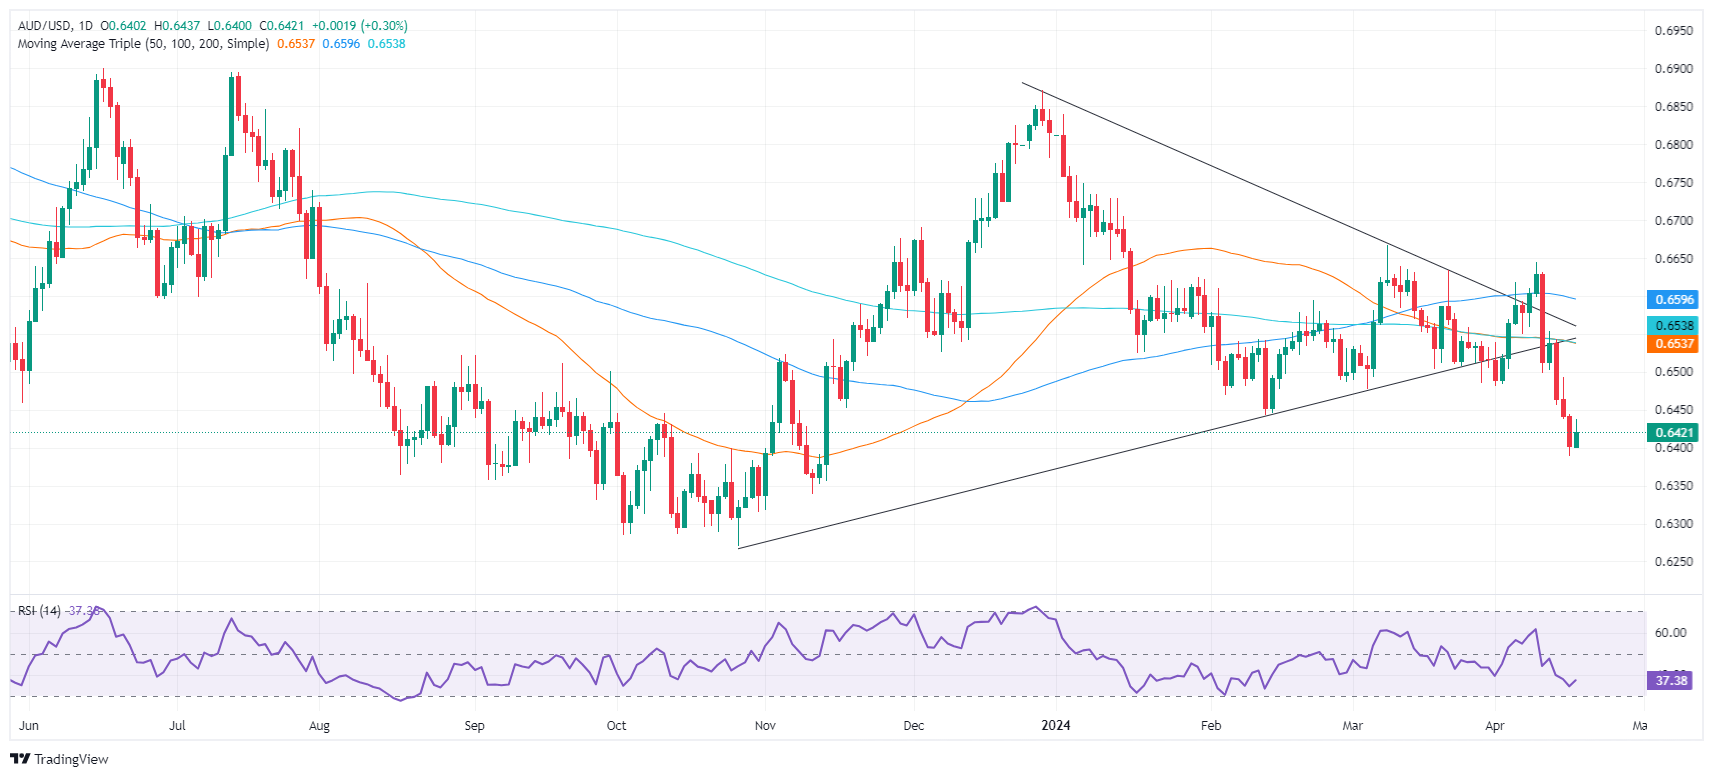
As can be seen from the chart below, an overall bearish tone dominates price action after the new year-to-date low made on Tuesday at 0.6389.
AUD/USD Daily Chart
The most recent leg down, which started on April 10, was driven by a sudden strengthening in the US Dollar (USD).
A run of strong macroeconomic data from the US, a solid labor market and persistently high inflation means the US Federal Reserve (Fed) cannot go ahead and cut interest rates as soon as it had been planning.
The expectation of interest rates remaining higher for longer in the US in order to continue cooling down the economy, has supported the US Dollar because higher interest rates attract greater inflows of foreign capital.
The sell-off in AUD/USD was not as steep as in other Dollar pairs, however, because stubbornly high inflation in Australia means the Reserve Bank of Australia (RBA) is also expected to delay cutting interest rates. It was less vocal about cutting them at the start of the year, however, unlike the Federal Reserve (Fed).
In Australia, a similar delay means the Reserve Bank of Australia (RBA) is now not expected to lower the 4.35% overnight cash rate until November 2024.
“Markets currently price the RBA cash rate to be unchanged at the next meeting on 7 May, with a 60% chance of a cut by November,” said Westpac in a recent note.
There has been a surprising down shift in the number of cuts the RBA is expected to make in 2024 over the past month, which mirrors what has happened in the US with the Fed.
“The market is pricing in 90% odds of a 25 bp rate cut in 2024 vs. almost 50 bp of total easing that was seen earlier this month,” according to BBH.
The main macroeconomic data to come out of Australia over the last few sessions was the Australian Bureau of Statistics Labour Force Survey (LFS).
This showed employment down by 6.6k (from plus 117.6k in February), the Unemployment Rate rising to 3.8% (from 3.7%) and the Participation Rate at 66.6% (from 66.7%).
The data failed to move the dial with regards to the Aussie Dollar.
“It provided a slightly better read on the underlying state of labour market conditions over the opening quarter,” according to Westpac.
Even though the Unemployment Rate rose to 3.8%, it is still below the RBA’s estimated full employment range of 4.0% - 5.75%, so is unlikely to impact their policy decisions in the near term, and therefore the Australian Dollar.
-
17.04.2024 15:27AUD/USD advances against US Dollar on mixed US data, Aussie jobs up next
- AUD/USD is buoyed by an improved risk sentiment and a sluggish US economic calendar.
- Wall Street opens higher, influencing currencies despite a slight increase in the US Dollar Index.
- Upcoming Australian employment data could impact AUD strength, with forecasts suggesting modest job growth.
The Australian Dollar makes a U-turn and rises against the US Dollar in early trading during the North American session, gaining 0.33% amid an improvement in risk appetite. A scarce economic calendar in the United States (US) and hawkish comments from Federal Reserve Chair Jerome Powell failed to boost the Greenback. The AUD/USD trades at 0.6423.
AUD/USD gains despite hawkish Fed comments; focus on Australian jobs data
Wall Street is setting the tone, opening with gains. US Treasury yields tumble but do not undermine the buck, which stays firm, as depicted by the US Dollar Index (DXY). The DXY is up 0.11%, at 106.24.
US data revealed during the week showed that American consumers remain resilient while Industrial Production stands tall. On the negative front, US Building Permits and Housing Starts plunged due to higher mortgage rates. The Mortgage Bankers Association (MBA) revealed that rates for 30-year mortgages edged up from 7.01% to 7.13%.
In addition to the data, Fed Chair Jerome Powell said that the lack of progress on inflation would likely require keeping rates steady for “as long as needed.” The markets perceived Powell as hawkish, though Wednesday’s price action suggests the opposite.
In December 2023, the Fed revealed in its projections that most officials expected to cut rates three times due to the evolution of the disinflation process. Nevertheless, three months of higher inflation than expected via the Consumer Price Index (CPI) sparked Powell’s tilt and a repricing of fewer rate cuts than foreseen.
On the Australian front, it would feature the release of jobs data. The Employment Change is expected to add 7.2K jobs to the workforce, well below the 116.5K created in February, while the Unemployment Rate is foreseen to edge close to 4%. If the data comes weak, that would warrant a more accommodative policy by the Reserve Bank of Australia. Hence, AUD/USD traders could push the pair lower.
AUD/USD Price Analysis: Technical outlook
Despite recovering, the AUD/USD is bearishly biased, and it would require buyers to achieve a daily close above the February 13 low of 0.6442. Otherwise, the pair's first support would be the 0.6400 mark, followed by the April 16 daily low of 0.6389. The next support would be 0.6350, followed by the 0.6300 mark.
-
17.04.2024 13:18AUD/USD rebounds from 0.6400 even Fed Powell delivers hawkish guidance
- AUD/USD recovers from 0.6400 amid improved market sentiment.
- The Aussie Employment data will guide market expectations for RBA rate cuts.
- It is forecasted that Australian employers hired mere 7.2K workers in March.
The AUD/USD pair finds a cushion near the round-level support of 0.6400 in Wednesday’s early American session. A three-day losing spell in the Aussie asset has concluded for now as investors expect that nations other than the United States are also facing stubborn inflation issues.
The Consumer Price Index (CPI) data for the United Kingdom and the New Zealand economies released in Wednesday’s session indicated that the last mile for inflation to return to the 2% target is bumpy. UK’s inflation softened slower than estimated in March while NZ inflation grew as expected in the first quarter of 2024.
This has forced traders to reprice their expectations for initial rate cuts. For the Bank of England (BoE) and the Reserve Bank of New Zealand (RBNZ), investors are now expecting that they will pivot to rate cuts from the November meeting instead of September.
Meanwhile, the market sentiment has improved. Considering bullish overnight futures, the S&P 500 is expected to open on a positive note. 10-year US Treasury yields fall slightly to 4.64% after refreshing a five-month high at 4.7%. The US Dollar Index (DXY) turns sideways after printing a fresh five-month high at 106.40. The US Dollar holds strength as Federal Reserve (Fed) Chair Jerome Powell leaned for keeping interest rates higher for a longer period as inflation data for March was not encouraging.
On the Australian Dollar front, investors await the Employment data for March, which will be published on Thursday. The Unemployment Rate is forecasted to have increased to 3.9% from 3.7% in February. In the same period, Australian employers are estimated to have hired 7.2K workers, significantly lower from 116.5K. Weak employment numbers would lift expectations for rate cuts by the Reserve Bank of Australia (RBA).
-
16.04.2024 13:53AUD/USD extends downside to 0.6400 as Fed seems to delay rate cuts
- AUD/USD slips to 0.6400 amid Middle East tensions, faded speculation for Fed rate cuts.
- Fed Daly sees no urgency for rate cuts with high inflation and a strong labor demand.
- The Chinese economy has exhibited a strong footing in the first quarter of this year.
The AUD/USD pair slumps to near the round-level support of 0.6400 in Tuesday’s early American session. The Aussie asset has extended its losing streak for the third trading session on Tuesday as the broader market mood is risk-averse due to worsening Middle East tensions and expectations that the Federal Reserve (Fed) will delay rate cut plans to later this year.
Risk-sensitive currencies have come under pressure as escalating Middle East tensions are expected to disrupt global supply chain. The Israeli military is anticipated to retaliate to Iran for its airstrikes on their territory. Meanwhile, US President Joe Biden said that he wont support the counterattack from Israel.
10-year US Treasury yields jump further to 4.68% as speculation for the Fed reducing interest rates in the June and July policy meeting have receded. Robust US Retail Sales data for March has reinforced expectations that there will be no urgency from the Fed for rate cuts.
San Francisco Fed Bank President said on Monday that “There is "no urgency" to cut US interest rates.” With inflation remaining hot and demand for labor remains strong, the Fed is expected to maintain a restrictive interest rate stance until it gains confidence that inflation will sustainably return to the desired rate of 2%.
In the Asian region, stronger-than-anticipated China’s Q1 Gross Domestic Product (GDP) data failed to improve the market sentiment. In the first quarter of this year, the Chinese economy strongly expanded by 1.6% from 1.2% in the last quarter of 2023, revised higher from 1.0%. The Australian Dollar is expected to get benefitted by China’s improving economic outlook.
On the domestic front, the Australian Dollar will be guided by the Employment data for March, which will be published on Thursday. The Unemployment Rate is forecasted to have increased to 3.9% from 3.7% in February. In the same period, Australian employers are estimated to have hired 7.2K workers, significantly lower from 116.5K.
-
15.04.2024 18:13AUD/USD dips amid strong US Retail Sales and risk aversion
- Aussie Dollar falls to 0.6452 after higher-than-expected US Retail Sales show strong consumer activity.
- Rising US Treasury yields suggest diminishing hopes for Federal Reserve rate cuts, shifting market expectations.
- Middle East tensions and forthcoming Chinese economic data will shape AUD/USD's short-term path.
The Aussie Dollar extended its losses against the Greenback during the North American session, dropping some 0.08% after hitting a daily high of 0.6493. The AUD/USD trades at 0.6452 following the release of strong US Retail Sales data.
Australian Dollar weakens as robust US economic data dampen rate cut expectations
The US Department of Labor revealed that Sales in March smashed estimates of 0.4% and rose by 0.7% MoM. At the same time, Retail Sales in the control group– used to calculate the Gross Domestic Product (GDP) – jumped from 0.3% in February to 1.1% MoM in March, crushing forecasts of a 0.4% expansion.
Following the data, US Treasury yields soared, a reflection that investors expected fewer interest rate cuts by the Federal Reserve. Data from the Chicago Board of Trade (CBOT) shows traders expecting two rate cuts instead of three toward the end of the year, an indication that rates would end at the 4.75%-5.00% range.
Other data showed that the National Association of Home Builders (NAHB) Housing Market Index remained unchanged at 51 in April due to mortgage rates standing at 7%. NAHB Chairman Carl Harris said, "April’s flat reading suggests potential for demand growth is there, but buyers are hesitating until they can better gauge where interest rates are headed.”
Risk appetite is significantly impacting the AUD/USD, courtesy of tensions arising in the Middle East. The recent offensive by Iran against Israel, which finished without casualties, has underscored the potential volatility in the region and its potential impact on the AUD/USD.
Earlier, New York Fed President John Williams commented that he expects the US central bank to begin to ease policy in 2024 while emphasizing that current policy is restrictive. Regarding the robust retail sales data, he added that strong fundamentals are driving consumer spending.
The lack of economic data from Australia, would keep investors focused on upcoming Chinese data. China’s schedule would feature Industrial Production, GDP, and Retail Sales. If the data proves to be weak, it could undermine the prospects of the AUD/USD and open the door to test 0.6400.
AUD/USD Price Analysis: Technical outlook
The daily chart confirms the AUD/USD is bearishly biased, with traders eyeing a clear break of the February 13 low of 0.6442, once cleared, would refresh yearly lows and open the door to challenge 0.6400. Further downsides are seen below that level, like the November 10, 2023, low at 0.6336. On the other hand, if buyers lift the AUD/USD past 0.6450, look for an impulse move toward 0.6500.
-
14.04.2024 23:33AUD/USD sticks to modest gains, upside seems limited amid geopolitical risks and bullish USD
- AUD/USD stages a modest recovery from a two-month low touched on Friday.
- The uptick seems unaffected by the Iranian attack on Israel over the weekend.
- Reduced Fed rate cut bets favor the USD bulls and should cap gains for the pair.
The AUSD/USD pair attracts some buyers on the first day of a new week and recovers a part of Friday's losses to the 0.6455 area, or its lowest level since February 14. Spot prices, meanwhile, react little to the latest geopolitical developments and trade around the 0.6470-0.6475 region during the Asian session, though any meaningful appreciating move still seems elusive.
Iran launched explosive drones and missiles at Israel late on Saturday in retaliation for a suspected Israeli attack on its consulate in Syria earlier this month, raising the risk of a further escalation of conflicts in the Middle East. The markets, however, remain relatively calm, which is evident from a generally positive tone around the US equity futures and turns out to be a key factor lending some support to the risk-sensitive Australian Dollar (AUD). The US Dollar (USD), on the other hand, stands tall near its highest level since early November amid hawkish Federal Reserve (Fed) expectations and caps the upside for the AUD/USD pair.
Data released from the US last week did little to ease concerns about still-sticky inflation and reinforced market expectations that the Fed will delay cutting interest rates this year. Adding to this, comments by a slew of influential FOMC members forced investors to push back their expectations for the first rate cut to September from June. The outlook keeps the US Treasury bond yields elevated near the YTD peak touched last week, which, along with persistent geopolitical tensions, should underpin the safe-haven Greenback. This, in turn, warrants some caution before confirming that the AUD/USD pair has bottomed out in the near term.
Moving ahead, the market focus now shifts to the US economic docket – featuring the release of monthly Retail Sales figures and the Empire State Manufacturing Index. This, along with Fedspeak and geopolitical developments, will drive the USD demand and provide some impetus to the AUD/USD pair ahead of the Chinese macro data dump during the Asian session on Tuesday. Investors this week will also take cues from Fed Chair Jerome Powell's appearance and the release of Australian employment details on Thursday.
-
12.04.2024 08:58AUD/USD Price Analysis: Bears await sustained break and acceptance below 0.6500 mark
- AUD/USD meets with a fresh supply on Friday and drops back closer to the weekly low.
- Weaker Chinese trade data undermine the Aussie amid strong follow-through USD buying.
- The technical setup favours bearish traders and supports prospects for additional losses.
The AUD/USD pair comes under some renewed selling pressure on Friday and extends its steady intraday descent through the early part of the European session. Spot prices touch a fresh daily low following the release of weaker Chinese trade data, albeit manage to hold above the 0.6500 psychological mark and rebound a few pips in the last hour.
Any meaningful recovery, however, still seems elusive in the wake of strong follow-through US Dollar (USD) buying, bolstered by expectations that the Federal Reserve (Fed) will keep interest rates higher for longer amid sticky US inflation. Apart from this, persistent geopolitical tensions stemming from conflicts in the Middle East benefit the safe-haven Greenback and might further contribute to capping the risk-sensitive Aussie.
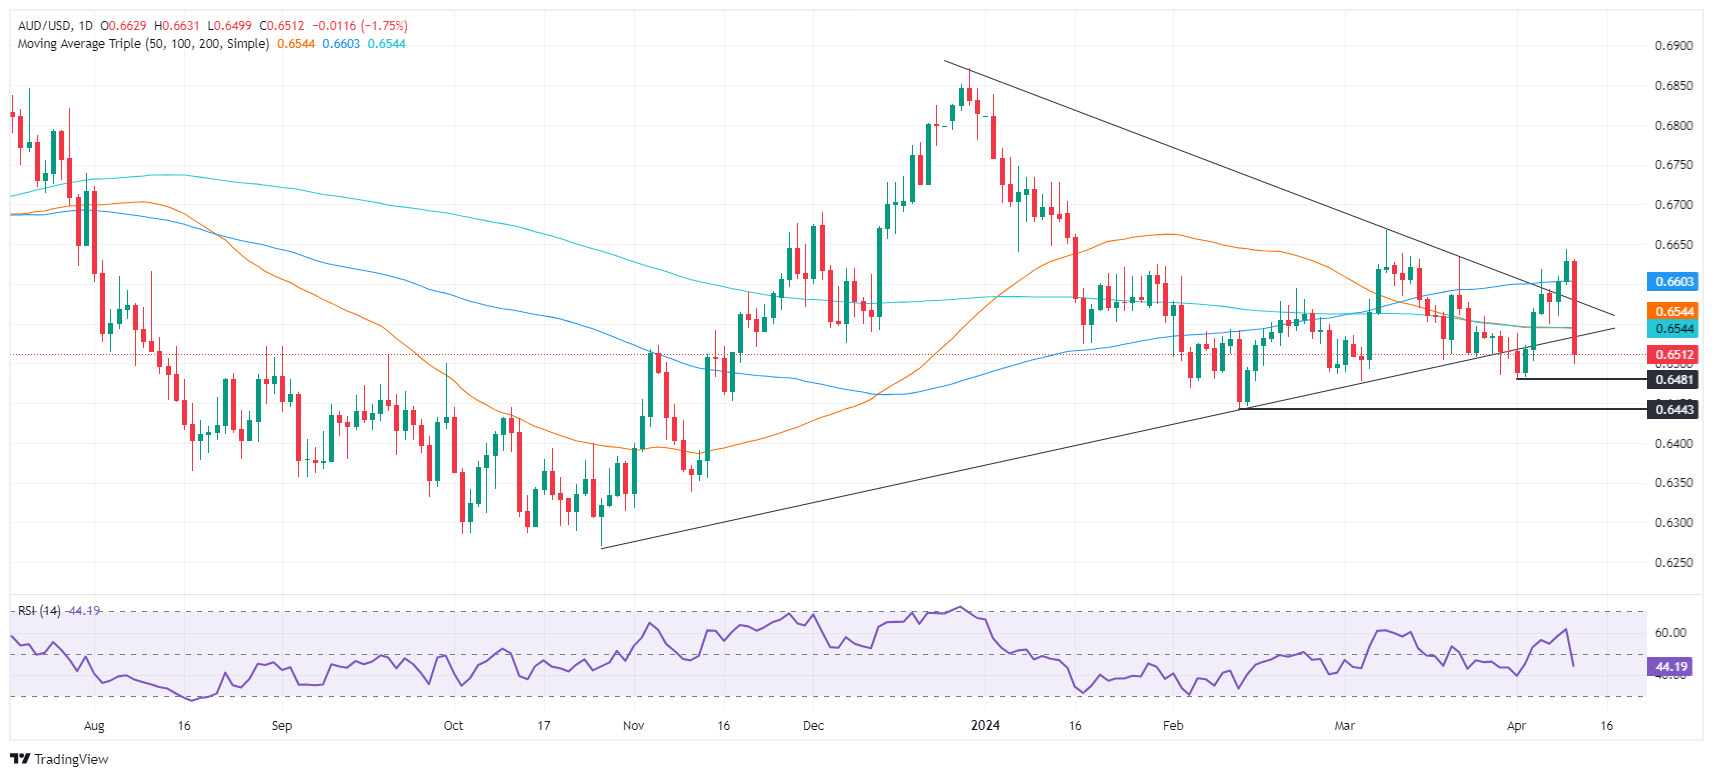
From a technical perspective, the AUD/USD pair, so far, has managed to defend the 0.6500 mark, which should now act as a key pivotal point. Given that oscillators on the daily chart have just started gaining negative traction, a convincing break below will be seen as a fresh trigger for bearish traders and set the stage for an extension of the recent sharp pullback from the 0.6645 area, or a one-month high touched earlier this week.
Some follow-through selling below the 0.6480 area, or the monthly low, will reaffirm the negative bias and allow the AUD/USD pair to aim back to challenge the YTD trough, around the 0.6445-0.6440 region touched in February. The downward trajectory could extend further towards the 0.6400 mark en route to the next relevant support near the 0.6355-0.6350 zone.
On the flip side, any attempted recovery is likely to confront stiff resistance near the 0.6545-0.6555 region, which coincides with the very important 200-day Simple Moving Average (SMA). This is followed by the 100-day SMA, currently pegged near the 0.6600 mark, above which a bout of a short-covering move has the potential to lift the AUD/USD pair back towards the 0.6640-0.6645 area, or the monthly swing high.
AUD/USD daily chart
-
12.04.2024 05:09AUD/USD slides to 0.6525 area, fresh daily low as traders await Chinese trade data
- AUD/USD comes under some renewed selling pressure and erodes a part of the overnight gains.
- Reduced Fed rate cut bets, along with geopolitics, underpin the USD and drag spot prices lower.
- Chinese trade data, the US consumer sentiment index and Fedspeak eyed for a fresh impetus.
The AUD/USD pair meets with a fresh supply during the Asian session on Friday and erodes a part of the previous day's goodish intraday move up from the 0.6500 psychological mark. Spot prices currently trade around the 0.6530-0.6525 area, though the downside seems cushioned amid mixed fundamental cues.
The South China Morning Post reported that Chinese Premier Li Qiang will visit Australia in June. This is seen as a sign of improving relations between Australia and China, which, in turn, is seen acting as a tailwind for the Aussie. Any meaningful appreciating move for the AUD/USD pair, however, seems elusive in the wake of the underlying bullish sentiment surrounding the US Dollar (USD), bolstered by hawkish Federal Reserve (Fed) expectations.
The hotter-than-expected US consumer inflation figures released on Wednesday forced investors to push back their bets about the timing of the first interest rate cut to September from June. The outlook keeps the US Treasury bond yields elevated, which, along with persistent geopolitical tensions, assists the USD to stand tall near the YTD peak. This, in turn, might continue to act as a headwind for the AUD/USD pair and warrants some caution for bulls.
Market participants now keenly await the release of Chinese trade balance data, which might influence the China-proxy Australian Dollar (AUD). Later during the early North American session, the Preliminary Michigan Consumer Sentiment Index and speeches by influential FOMC members will drive the USD demand, which, in turn, should provide some impetus to the AUD/USD pair. Nevertheless, spot prices seem poised to register weekly losses, though hold above the monthly swing low, around the 0.6480 region touched on April 1.
-
11.04.2024 23:20AUD/USD stays firm amid mixed US economic data
- AUD/USD edges up to 0.6539 after US producer inflation hints at easing pressures.
- US Jobless Claims drop, indicating a resilient labor market despite mixed economic signs.
- Federal Reserve officials express concerns over inflation trends, influencing market expectations about the timing and extent of future rate cuts.
The Australian Dollar recovered some territory against the US Dollar yet fell shy of reclaiming key technical resistance levels after Thursday’s US inflation data capped the Greenback's advance. As the Asian session begins, the AUD/USD trades at 0.6539, up by a minimal 0.02% at the time of writing.
AUD/USD shows a slight recovery after US PPI data underperforms expectations
On Thursday, the US Department of Labor revealed March’s Producer Price Index (PPI) with figures registering a 0.2% MoM increase, which is below the anticipated 0.3%. Similarly, the core PPI, which excludes volatile food and energy prices, also recorded a 0.2% increase, falling short of both estimates and the previous month's figure.
Annually based figures showed the PPI increasing by 2.1%, less than expected but up from February's 1.6%. Meanwhile, the core PPI over the same period stood at 2.4%, exceeding both forecasts and the figure from the prior month.
Other data revealed that the number of Americans filing for unemployment benefits fell, as Initial Jobless Claims for the week ending April 6 dipped from 222K to 211K, below estimates of 215K.
Given Thursday’s economic data's mixed outlook, AUD/USD traders booked profits following Wednesday’s plunge of 1.75%, which dragged spot prices to a fresh weekly low of 0.6498.
Elsewhere, Federal Reserve officials remain in a wait-and-see mode, led by New York Fed President John Williams, who commented that recent inflation data is disappointing. Richmond Fed Thomas Barkin added that “inflation data raise the question if we are seeing a shift.” Finally, Boston Fed Susan Collins added that she still sees rate cuts in 2024, though they could be fewer than projected.
In that regard, futures traders of Federal funds rates (FFR) are projecting that the Fed would ease policy twice, as shown by data from the Chicago Board of Trade (CBOT). The December 2024 contract depicts traders expect the FFR to end at 4.97%.
AUD/USD Price Analysis: Technical outlook
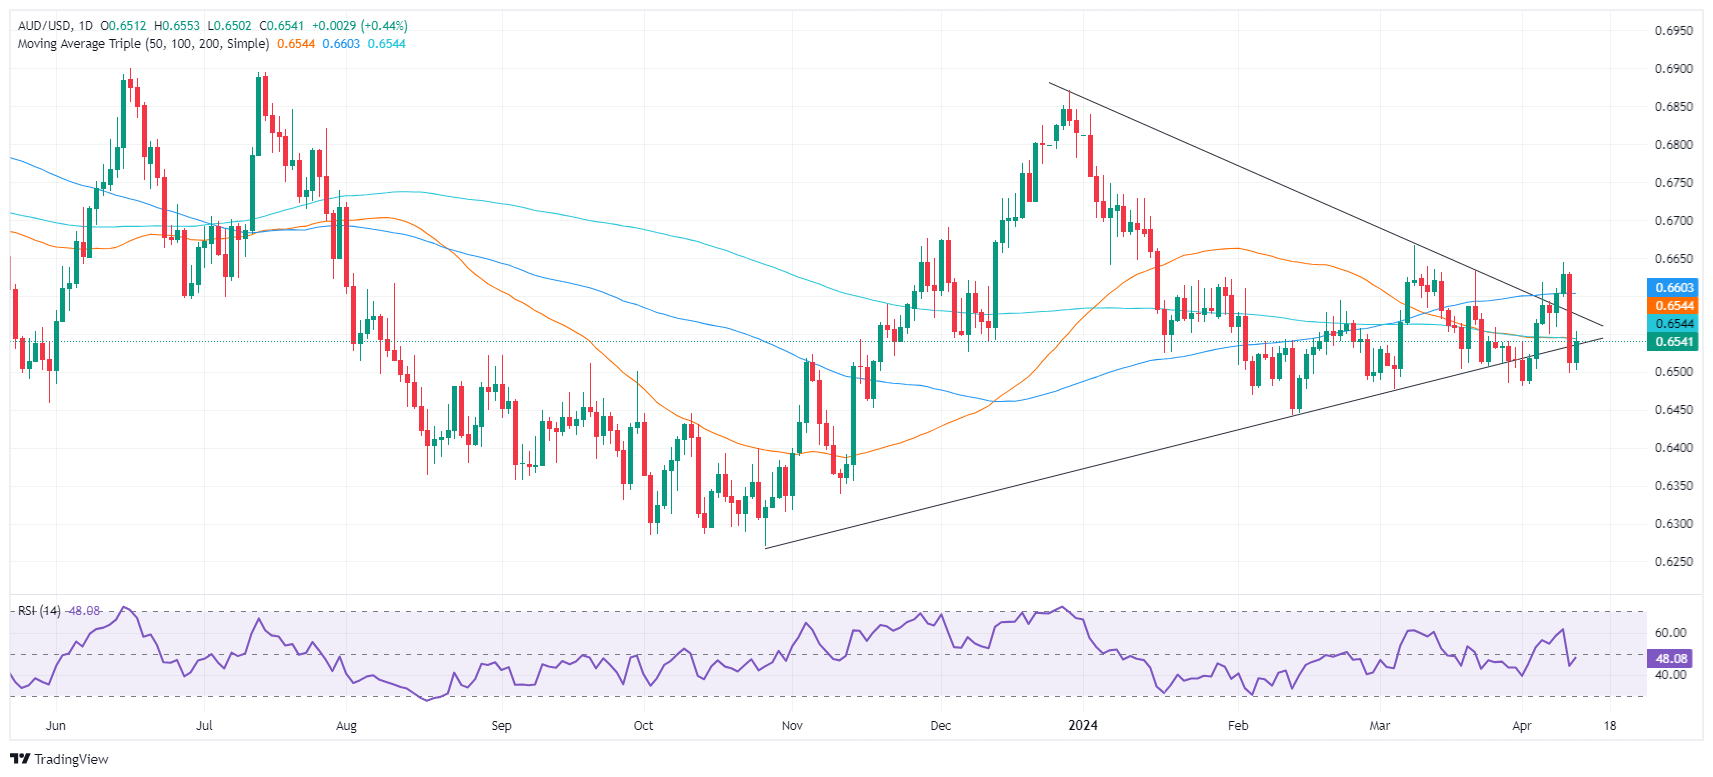
From a technical perspective, the AUD/USD tilted slightly bearish after cracking the confluence of the 50 and 200-day moving averages (DMAs) at 0.6541. If buyers conquer that level, the next resistance will be 0.6600. However, failure to do so will drive the exchange rate below 0.6500, opening the door to test April’s 1 low of 0.6483, ahead of the February 13 low of 0.6442.
-
11.04.2024 06:26AUD/USD Price Analysis: Finds temporary support near 0.6500
- AUD/USD finds intermediate support neat 0.6500, more downside remains likely.
- The US Dollar strengthens as market push back Fed rate cut expectations for June.
- Australia’s consumer inflation expectations for next 12 months rose to 4.6%.
The AUD/USD pair finds an interim support near the psychological level of 0.6500 in Thursday’s early European session. The Aussie asset is expected to continue the downside move as faded market expectations for the Federal Reserve (Fed) beginning to reduce interest rates in the first half of this year has dampened appetite for risk-sensitive currencies.
S&P 500 futures have posted nominal gains in the Asian session. While the overall market sentiment is downbeat as investors shift focus to the September policy meeting when the Fed could pivot to rate cuts. Prospects for Fed early rate cuts have waned as the United States inflation for March turned out sticky. The US Dollar Index (DXY) jumps to 105.20, approaching five-month high at 106.00.
The US Bureau of Labor Statistics (BLS) reported on Monday that annual and monthly core Consumer Price Index (CPI), which strips of volatile food and energy prices, rose steadily by 3.8% and 0.4%, respectively, suggested that rate cuts are not appropriate currently.
Meanwhile, expectations for the Reserve Bank of Australia (RBA) reducing interest rates sooner have eased due to a significant increase in consumer inflation expectations. The Melbourne Institute reported that inflation expectations for next 12 months accelerated to 4.6% from prior reading of 4.3%.
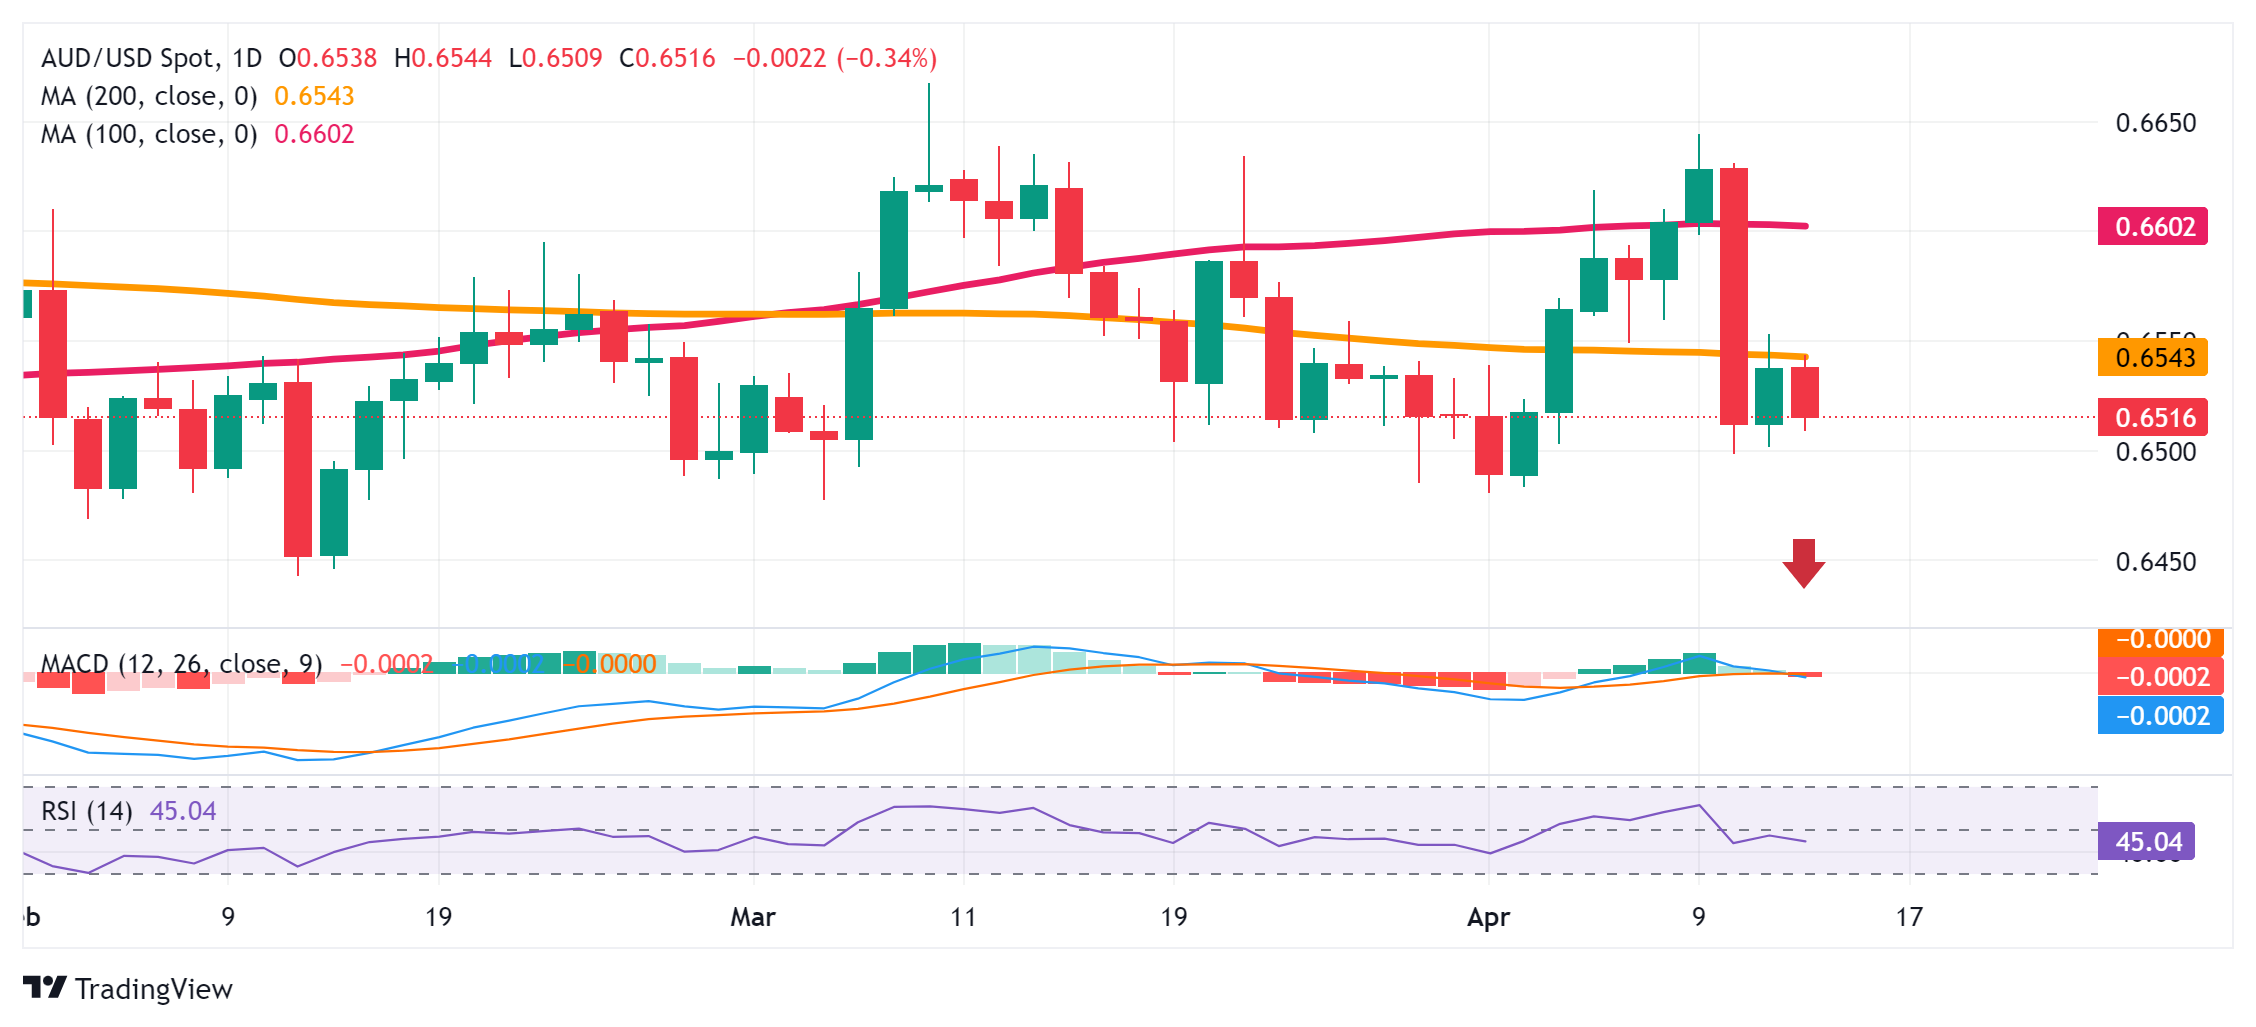
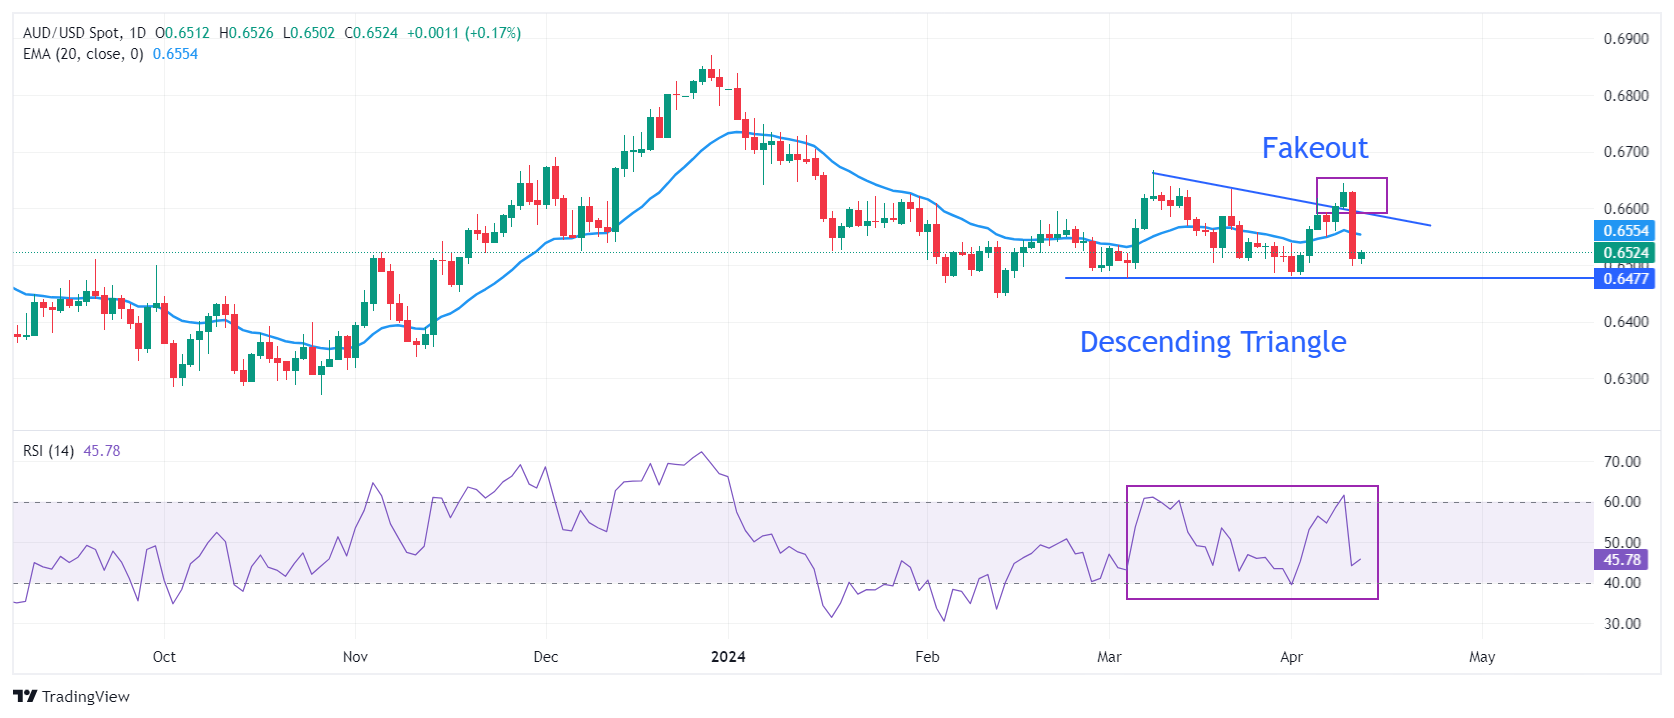
AUD/USD witnesses an intense sell-off after failing to sustain the breakout of the Descending Triangle chart pattern formed on a daily timeframe. The Aussie asset is declining towards the horizontal support of the aforementioned pattern plotted from March 5 low at 0.6477.
The Aussie asset falls below the 20-day Exponential Moving Average (EMA) trading near 0.6550, suggesting weak demand for the Australian Dollar.
The 14-period Relative Strength Index (RSI) falls sharply after failing to climb above 60.00, indicating limited upside.
Investors might build fresh shorts if the asset drops below March 28 low at 0.6485. Profits on shorts would be booked near February 13 low around 0.6440 and the round-level support of 0.6400.
In an alternate scenario, fresh upside would appear if the asset breaks above March 21 high at 0.6635. This will drive the asset toward March 8 high at 0.6667, followed by the round-level resistance of 0.6700.
AUD/USD daily chart
-
11.04.2024 01:44AUD/USD holds steady above 0.6500 mark, moves little after Chinese inflation data
- AUD/USD is seen consolidating Wednesday’s post-US CPI slump to over a one-week low.
- Bets that the Fed will delay cutting rates underpin the USD and cap the upside for the pair.
- Softer Chinese inflation figures do little to influence the Aussie or provide any impetus.
The AUD/USD pair oscillates in a narrow trading range during the Asian session on Thursday and consolidates the previous day's hotter US CPI-inspired slump to over a one-week low. Spot prices hold steady above the 0.6500 psychological mark and move little following the release of inflation figures from China.
The National Bureau of Statistics reported that China’s consumer inflation declined more than estimated, by 1% in March as compared to the previous month's rise of 1%. On a yearly basis, the headline CPI decelerated to 0.1% from 0.7% in the previous month, missing expectations for a 0.4% increase. Furthermore, the Producer Price Index, which measures wholesale prices at the factory gate, dropped by 2.8% from a year ago, marking the 18th consecutive month of decline and indicating persistent deflationary pressures. This, to a larger extent, overshadows a jump in Australian consumer inflation expectations to 4.6% for April from 4.3% previous and does little to provide any meaningful impetus to the Aussie.
The US Dollar (USD), on the other hand, ticks lower amid some profit-taking after the previous day's sharp spike to the highest level since November 14 and lends some support to the AUD/USD pair. Any meaningful USD corrective decline, however, still seems elusive in the wake of expectations that the Federal Reserve (Fed) will delay cutting interest rates amid sticky inflation. This, along with a generally weaker tone around the equity markets, should act as a tailwind for the safe-haven buck and cap the risk-sensitive Australian Dollar (AUD), warranting caution for aggressive bullish traders.
-
10.04.2024 22:47AUD/USD retreats amid surging US inflation, revised Fed rate cut expectations
- Australian Dollar faces a significant downturn as US inflation figures outpace forecasts, boosting the US Dollar and Treasury yields.
- Traders adjust Fed rate cut projections based on new inflation insights, with a less aggressive easing strategy anticipated.
- Upcoming economic reports, includes China's inflation data and the US PPI.
The Australian Dollar posted losses of more than 1.50% on Wednesday against the US Dollar following the release of a hotter-than-expected inflation report in the United States (US). Traders have begun to price in fewer rate cuts by the US Federal Reserve, a bullish signal for the Greenback. Therefore, the AUD/USD trades at 0.6511, virtually unchanged, as Thursday’s Asian session commences.
AUD/USD falls sharply to 0.6511, reacting to US CPI data
Mach’s Consumer Price Index (CPI) in the US exceeded estimates of 0.3% MoM in headline and core, with both readings edging a tenth higher at 0.4%. Yearly figures clocked 3.5% YoY in general inflation, crushing February’s data, while core CPI was unchanged at 3.8%. Following the release, US Treasury yields soared, the Greenback rallied, and Wall Street plummeted.
Consequently, interest rate futures traders priced in just two rate cuts, as witnessed by data released by the Chicago Board of Trade (CBOT). The Fed funds rate is projected to end the year at 4.99%.
Later, the March minutes of the Federal Open Market Committee (FOMC) revealed that “almost all participants judged that it would be appropriate to move policy to a less restrictive stance at some point this year if the economy evolved broadly as they expected.”
On the Aussie’s front, the economic schedule remains scarce, though traders will watch China’s March inflation report. In the US, further inflation data will be scrutinized, as the Producer Price Index (PPI) is expected to dip, while the number of Americans filing for unemployment benefits is expected to slow down compared to the previous reading.
AUD/USD Price Analysis: Technical outlook
From a price action standpoint, the AUD/USD shifted bearish bias and will face first support at the 0.6500 psychological figure. The Relative Strength Index (RSI) turning bearish, along with the break of key support levels, suggests that further downside is seen.
The AUD/USD first support would be the April 1 low of 0.6481, followed by the February 13 swing low at 0.6443. If those two levels are cleared, the pair will be trading at lower levels for the new year-to-date (YTD), with sellers eyeing the 0.6400 figure.
In the event buyers move in and reclaim the 200-DMA at 0.6603, look for a test of the next supply zone at 0.6631.
Australian Dollar FAQs
One of the most significant factors for the Australian Dollar (AUD) is the level of interest rates set by the Reserve Bank of Australia (RBA). Because Australia is a resource-rich country another key driver is the price of its biggest export, Iron Ore. The health of the Chinese economy, its largest trading partner, is a factor, as well as inflation in Australia, its growth rate and Trade Balance. Market sentiment – whether investors are taking on more risky assets (risk-on) or seeking safe-havens (risk-off) – is also a factor, with risk-on positive for AUD.
The Reserve Bank of Australia (RBA) influences the Australian Dollar (AUD) by setting the level of interest rates that Australian banks can lend to each other. This influences the level of interest rates in the economy as a whole. The main goal of the RBA is to maintain a stable inflation rate of 2-3% by adjusting interest rates up or down. Relatively high interest rates compared to other major central banks support the AUD, and the opposite for relatively low. The RBA can also use quantitative easing and tightening to influence credit conditions, with the former AUD-negative and the latter AUD-positive.
China is Australia’s largest trading partner so the health of the Chinese economy is a major influence on the value of the Australian Dollar (AUD). When the Chinese economy is doing well it purchases more raw materials, goods and services from Australia, lifting demand for the AUD, and pushing up its value. The opposite is the case when the Chinese economy is not growing as fast as expected. Positive or negative surprises in Chinese growth data, therefore, often have a direct impact on the Australian Dollar and its pairs.
Iron Ore is Australia’s largest export, accounting for $118 billion a year according to data from 2021, with China as its primary destination. The price of Iron Ore, therefore, can be a driver of the Australian Dollar. Generally, if the price of Iron Ore rises, AUD also goes up, as aggregate demand for the currency increases. The opposite is the case if the price of Iron Ore falls. Higher Iron Ore prices also tend to result in a greater likelihood of a positive Trade Balance for Australia, which is also positive of the AUD.
The Trade Balance, which is the difference between what a country earns from its exports versus what it pays for its imports, is another factor that can influence the value of the Australian Dollar. If Australia produces highly sought after exports, then its currency will gain in value purely from the surplus demand created from foreign buyers seeking to purchase its exports versus what it spends to purchase imports. Therefore, a positive net Trade Balance strengthens the AUD, with the opposite effect if the Trade Balance is negative.
-
10.04.2024 17:53AUD/USD plummets to the 0.6500 support area after the US CPI release
- Strong US CPI figures have sent the Aussie tumbling.
- US CPI accelerated 0.4% in March against expectations of a 0.3% reading. The yearly inflation jumps to 3.5% from 3.2% in the previous month
- AUD/USD is under pressure again, with support levels at 0.6480 and 0.6445 on the bears’ focus
Australian Dollar posted a strong reversal on Wednesday. The higher-than-expected US inflation levels have endorsed the Fed’s “higher for longer” stance, crushing risky assets like the Aussie.
Consumer inflation accelerated in the US in March, with the headline figures accelerating to 0.4%, against expectations of a 0.3% reading. Year-on-year, consumer prices rose at a 3.5% pace from 3.2% in February. The Core inflation accelerated to 0.4% from 0.3% in the previous month, while the yearly rate remained steady at 3.8%.
These levels confirm that the Fed has still some work to do to push inflation towards their 2% target, and practically ditch the markets’ view of three rate cuts in 2024 starting in June.
Later today, the Fed monetary policy minutes will be looked at from a different perspective following the CPI data. On Friday the PPI will add further insight into the inflation picture, although Fed’s Bostic and Williams, both on the hawkish side of the committee, might attract investors’ attention.
The technical picture looks increasingly bearish as the pair is on track to post a strong negative candle today. The 0.6480-0.6500 area might support the pair ahead of the big downside target, 0.6445. Resistances are 0.6550 and 0.6635.


© 2000-2024. All rights reserved.
This site is managed by Teletrade D.J. LLC 2351 LLC 2022 (Euro House, Richmond Hill Road, Kingstown, VC0100, St. Vincent and the Grenadines).
The information on this website is for informational purposes only and does not constitute any investment advice.
The company does not serve or provide services to customers who are residents of the US, Canada, Iran, The Democratic People's Republic of Korea, Yemen and FATF blacklisted countries.
Making transactions on financial markets with marginal financial instruments opens up wide possibilities and allows investors who are willing to take risks to earn high profits, carrying a potentially high risk of losses at the same time. Therefore you should responsibly approach the issue of choosing the appropriate investment strategy, taking the available resources into account, before starting trading.
Use of the information: full or partial use of materials from this website must always be referenced to TeleTrade as the source of information. Use of the materials on the Internet must be accompanied by a hyperlink to teletrade.org. Automatic import of materials and information from this website is prohibited.
Please contact our PR department if you have any questions or need assistance at pr@teletrade.global.
transfers